Deposits
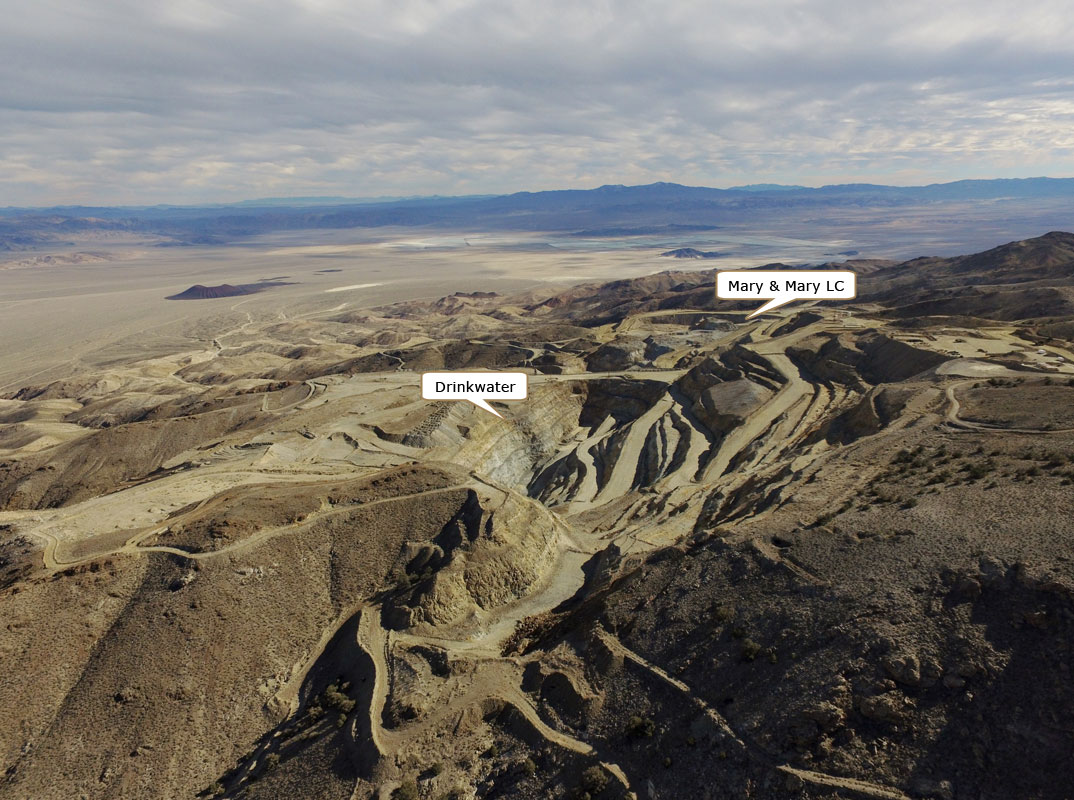
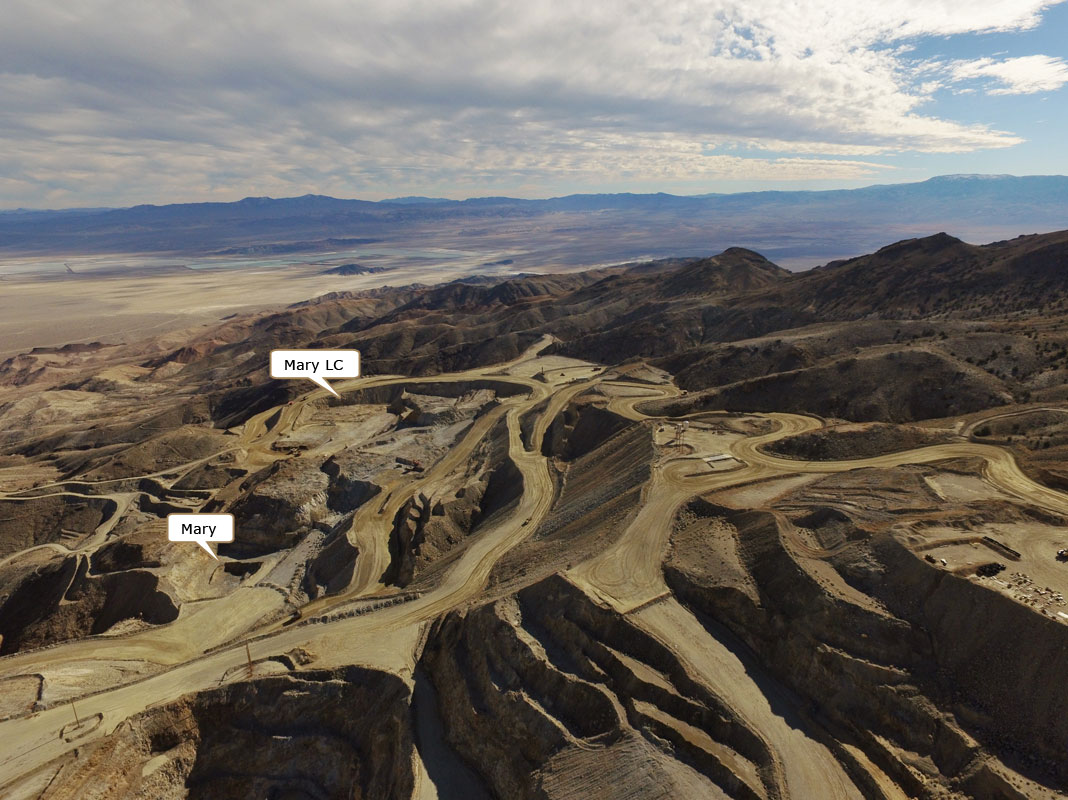
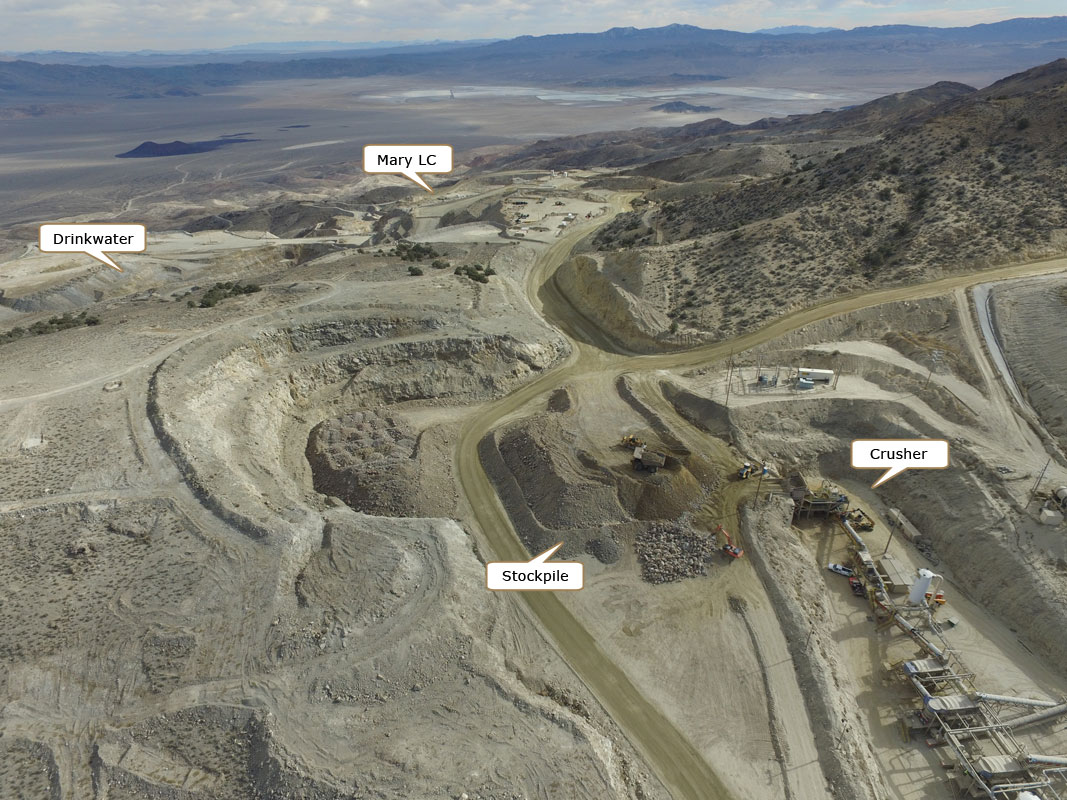
In 2014, the Company reported an updated Life of Mine Plan ("LOM Plan") for the Mineral Ridge Operation that included the Drinkwater, Mary, Mary LC, and the five satellite deposits, Brodie, Bluelite, Solberry, Wedge and Oromonte (see July 21, 2014 news release). As of November 2017, the Drinkwater, Bluelite, Solberry, Missouri, Wedge pits had been depleted and mining was suspended.
An updated feasibility study completed in Jan 2018 outlines positive economics for processing the residual heap leach material and mining of higher-grade mineralization remaining in the Brodie, Custer, Drinkwater Highwall, Mary LC, Bunkhouse and Oromonte deposits.
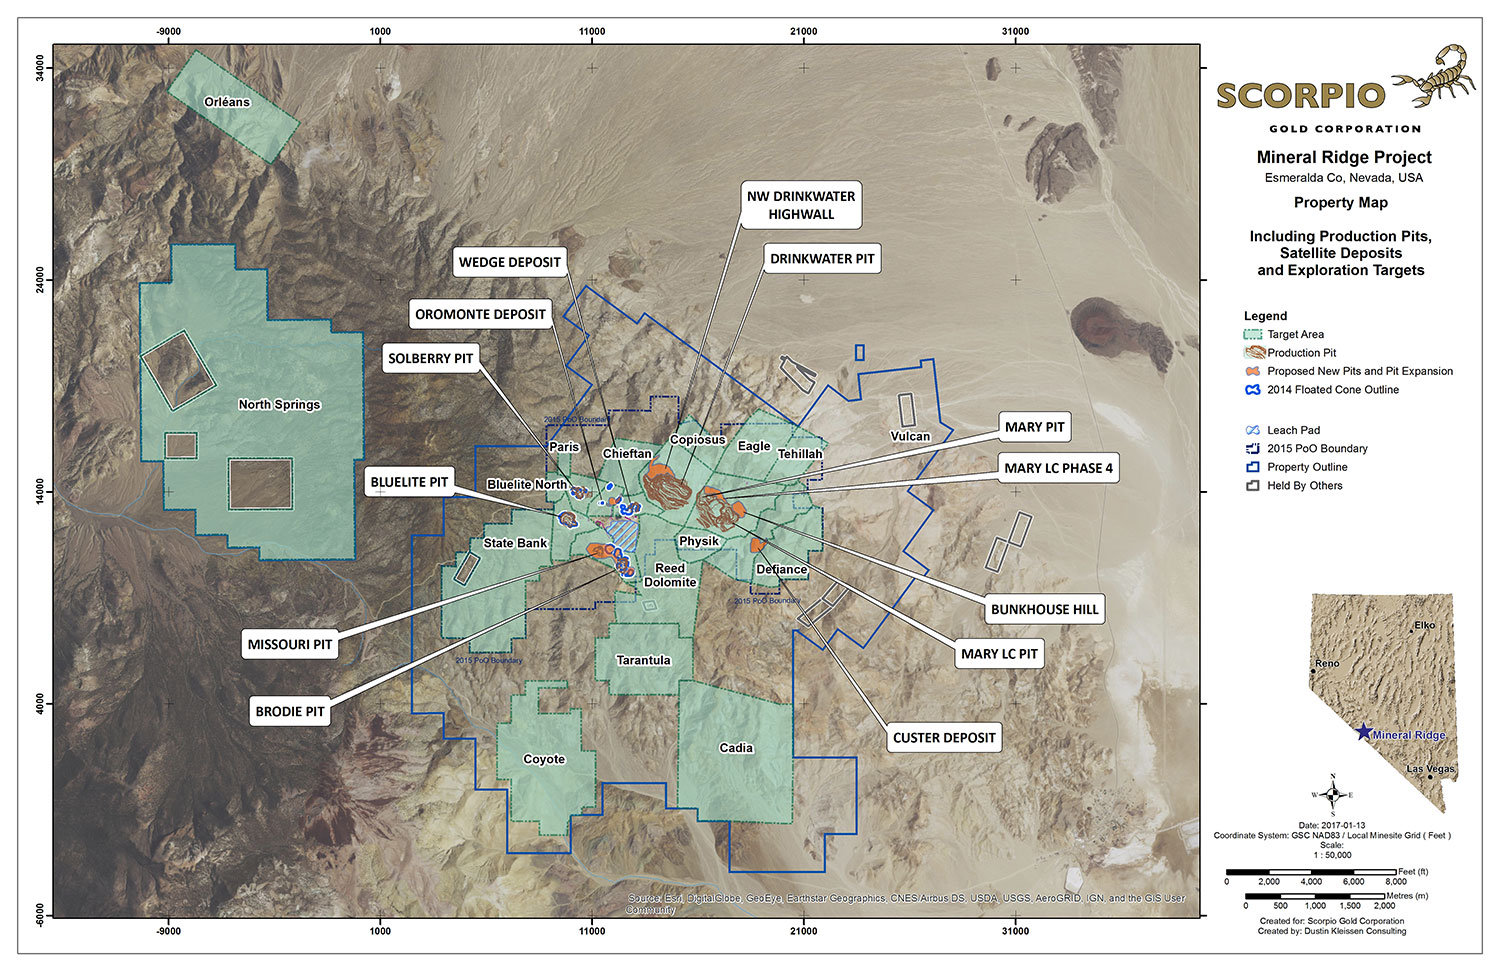
Property Map (PDF 2.9 Mb)
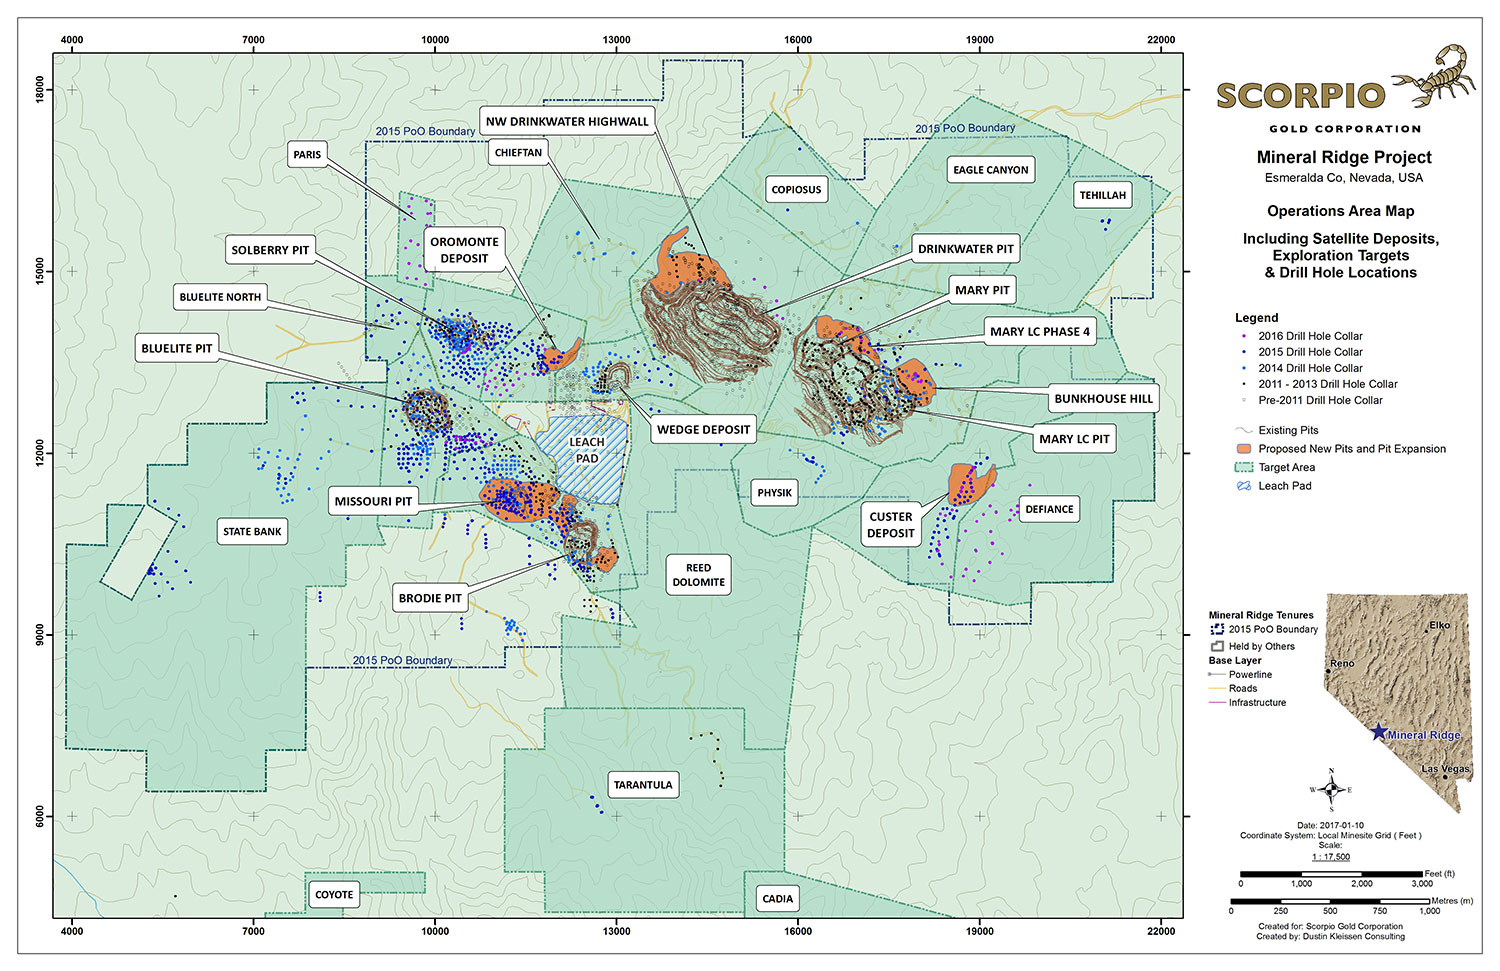
Operations Area Map (PDF 4.2 Mb)
Operations Area Map with Drill Hole Locations (PDF 2.6 Mb)
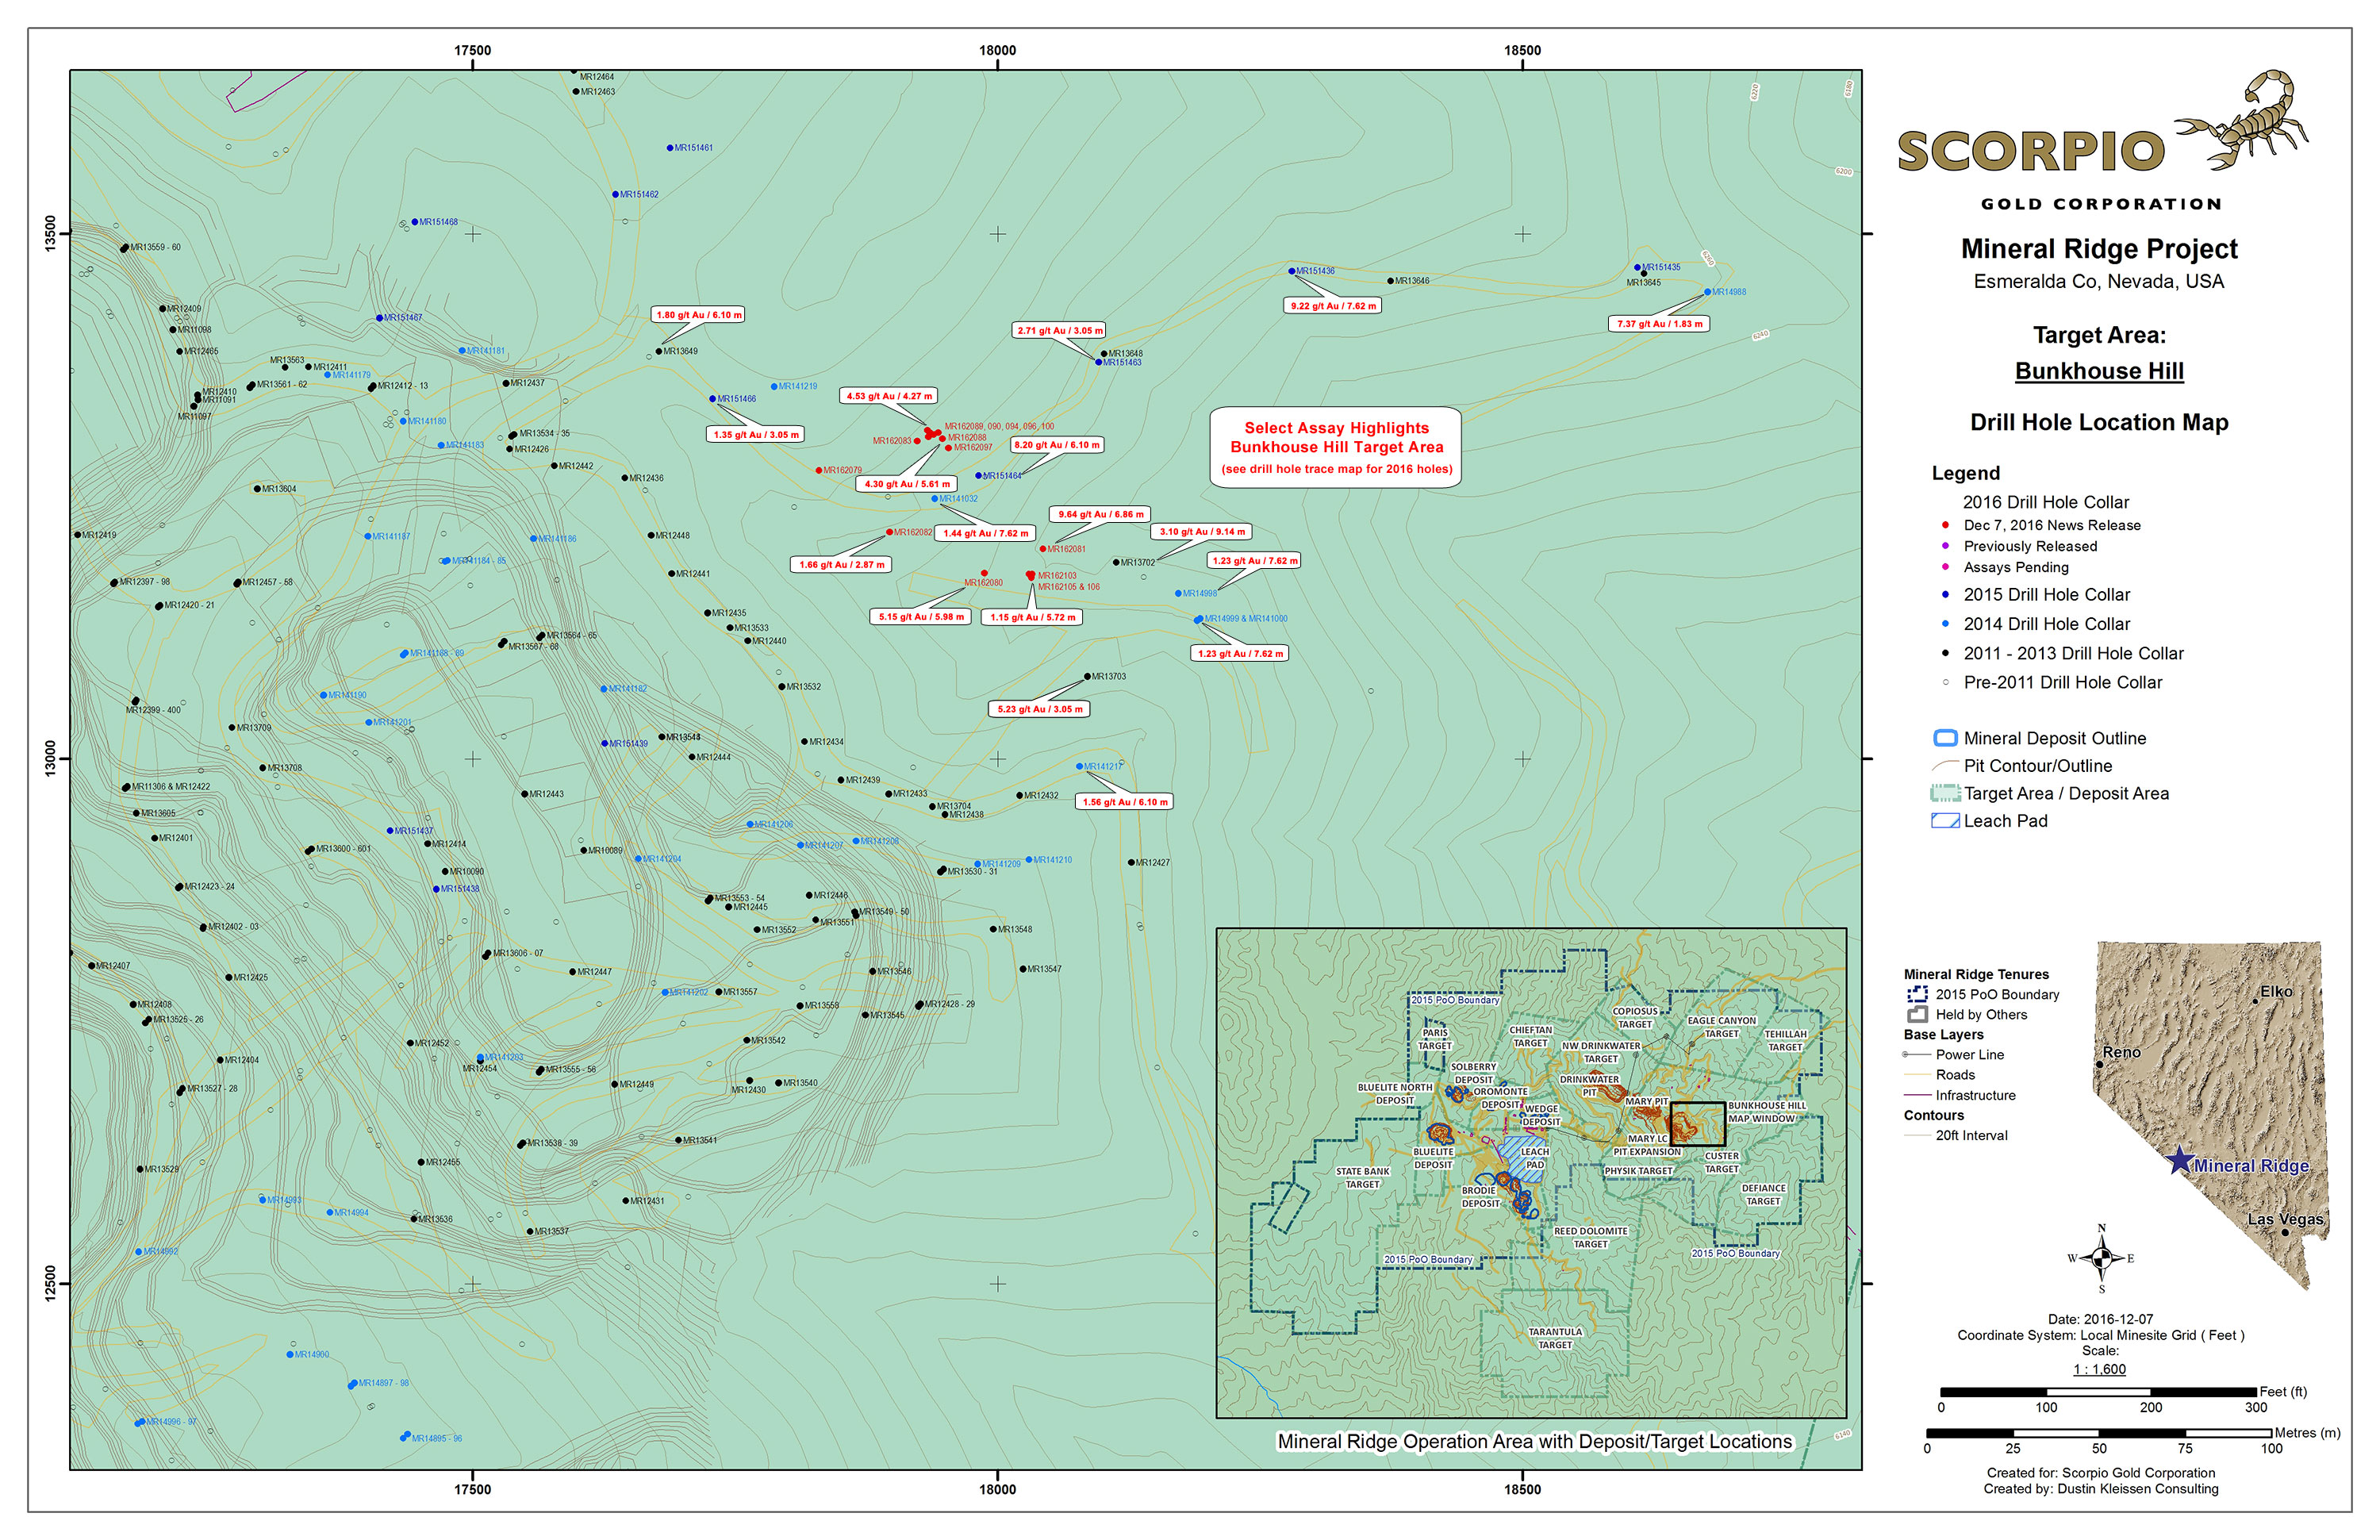
Bunkhouse Hill Target Area
The Bunkhouse Hill area extends northeast of the Mary LC pit. Drilling in 2015 intersected significant mineralization extending 250 meters northeast of the Mary LC pit at vertical depths of 50 to 150 meters. Fifteen RC holes were drilled in 2016 to further test and delineate the economics for extending the Mary LC pit into this area.
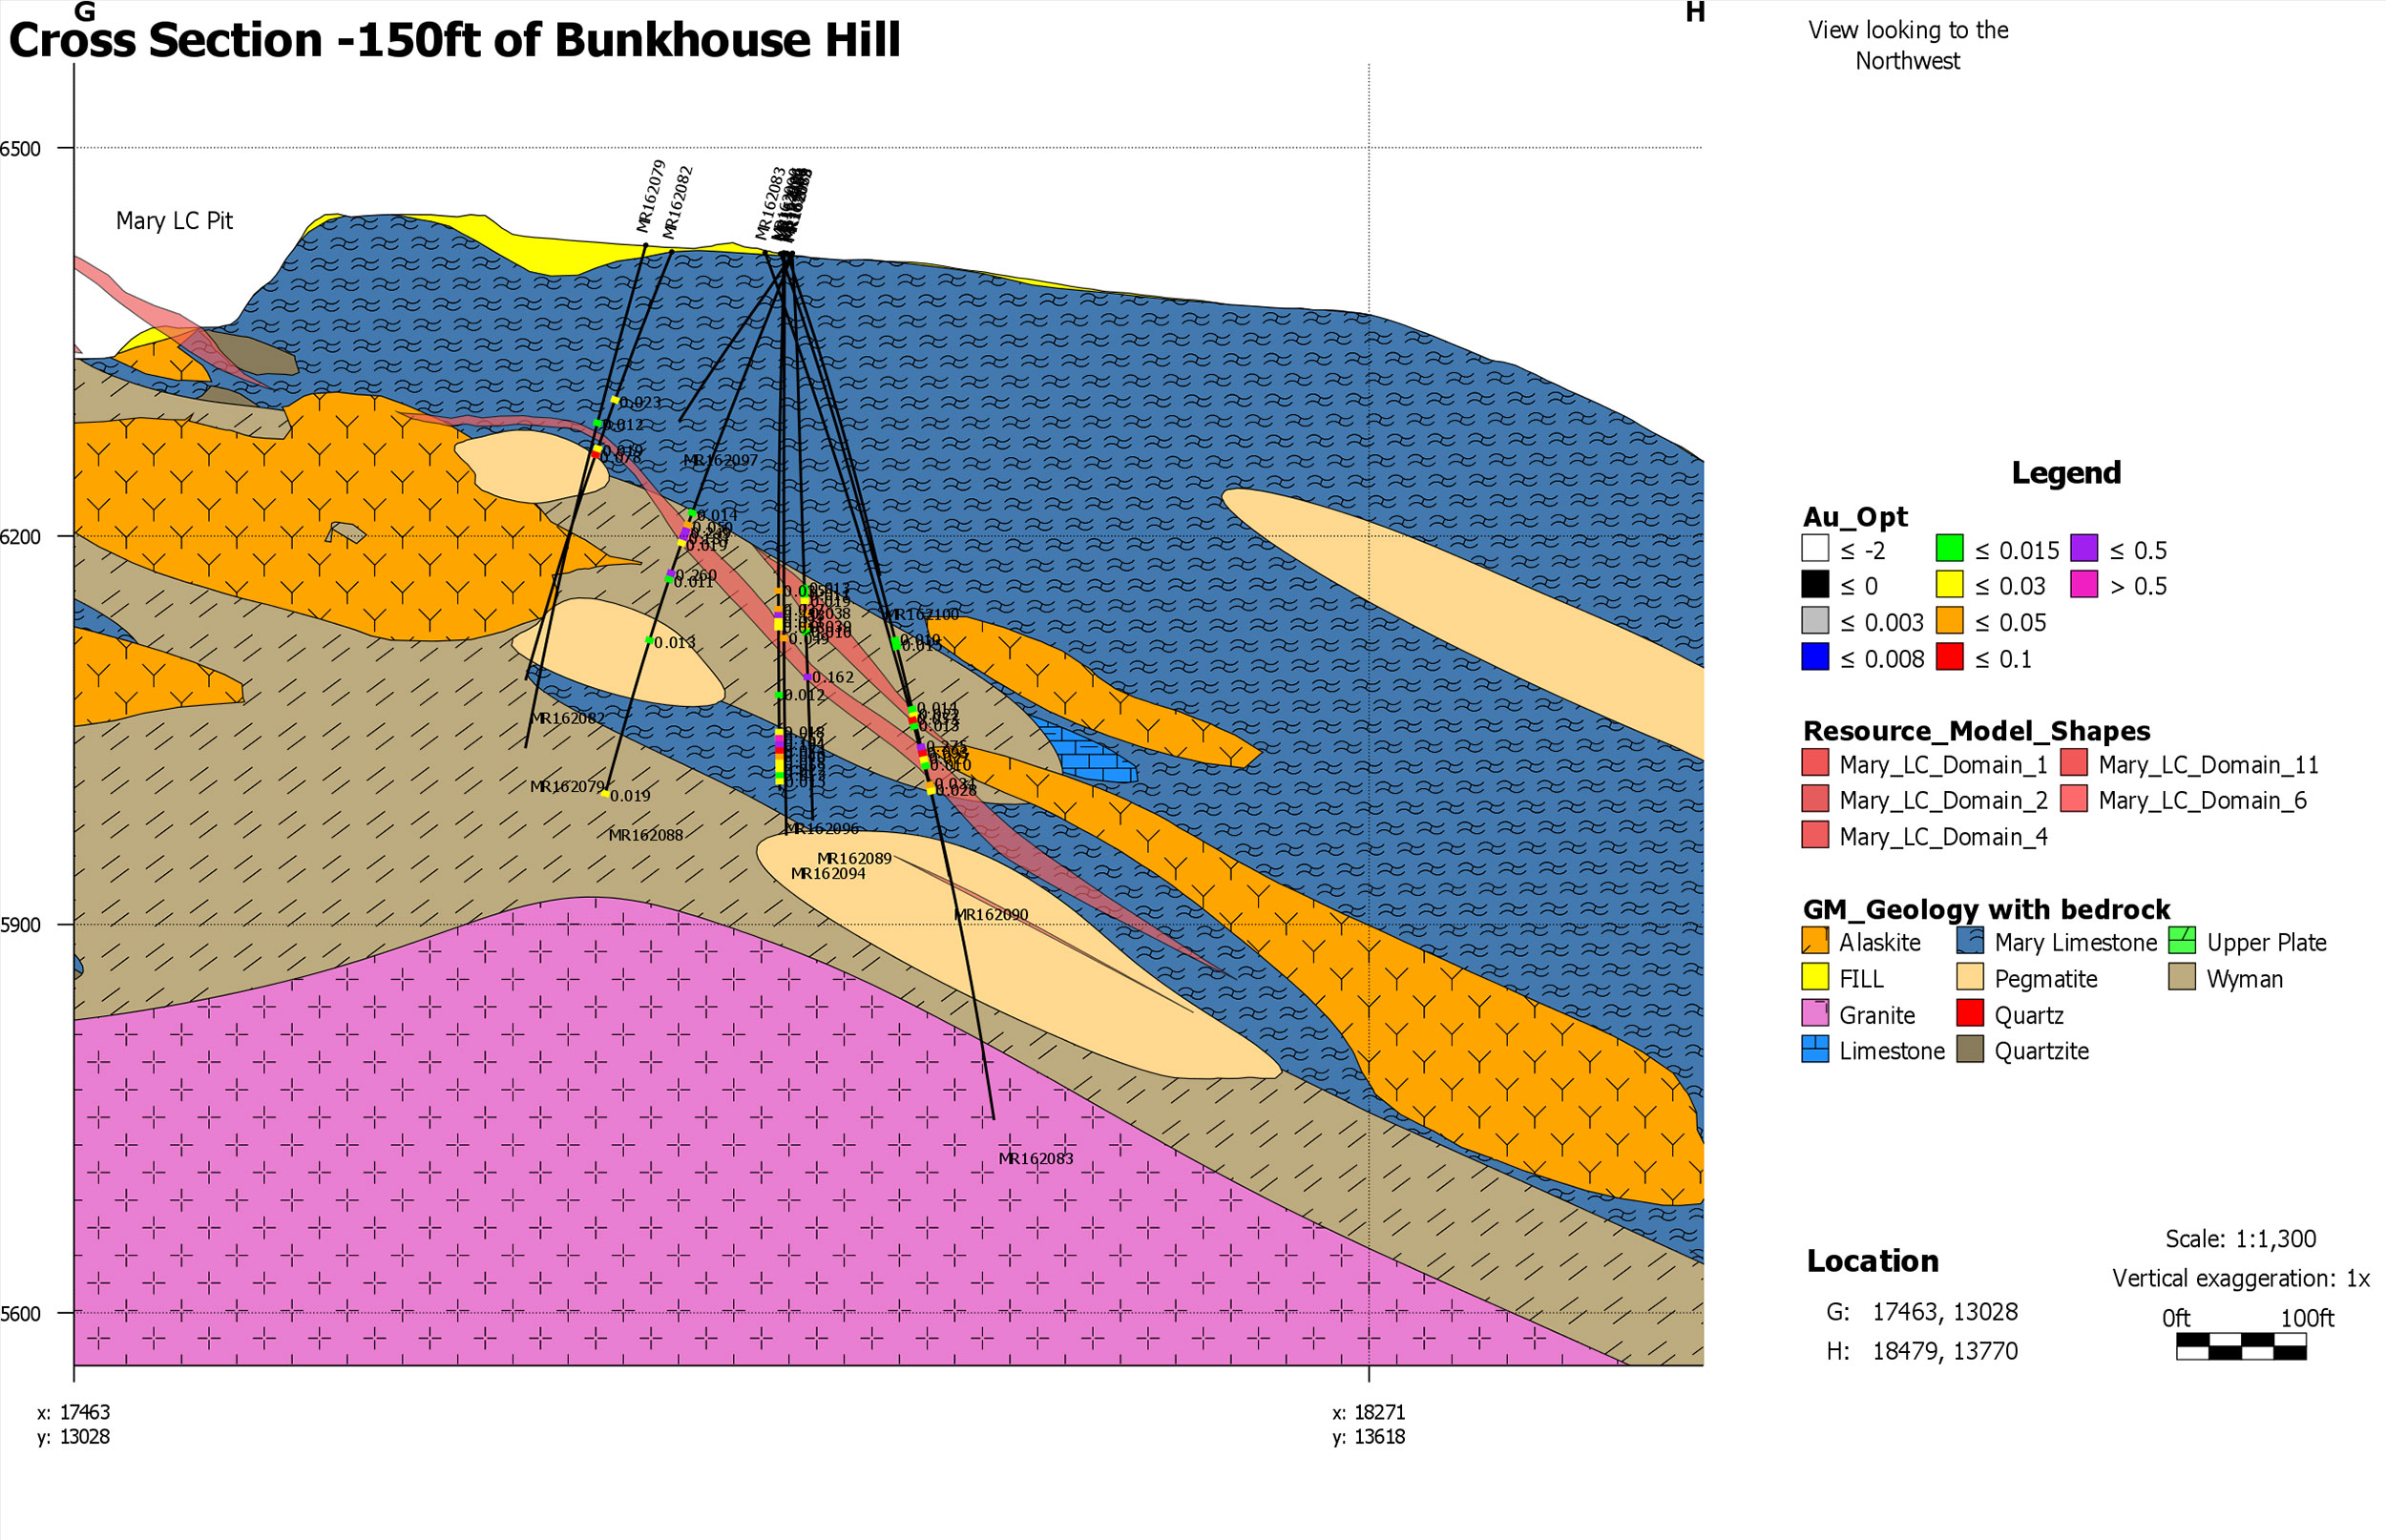
Geologically, the Bunkhouse Hill target is the immediate down-dip extension of the mineralization present in the Mary LC pit. The mineralization at Bunkhouse dips at 39° NE vs. the more typical 25-30° NE dip of the Mary LC mineralization. This dip change is spatially related to a change in geology, whereby the mineralized zone transitions from being hosted in felsic intrusive rocks to sedimentary rocks of the Wyman formation. Mapping work has shown how important this rheological contrast is in the formation of ore zones. The Bunkhouse target is currently defined over a ~150 x 450 meter area and mineralization remains open down dip to the northeast.
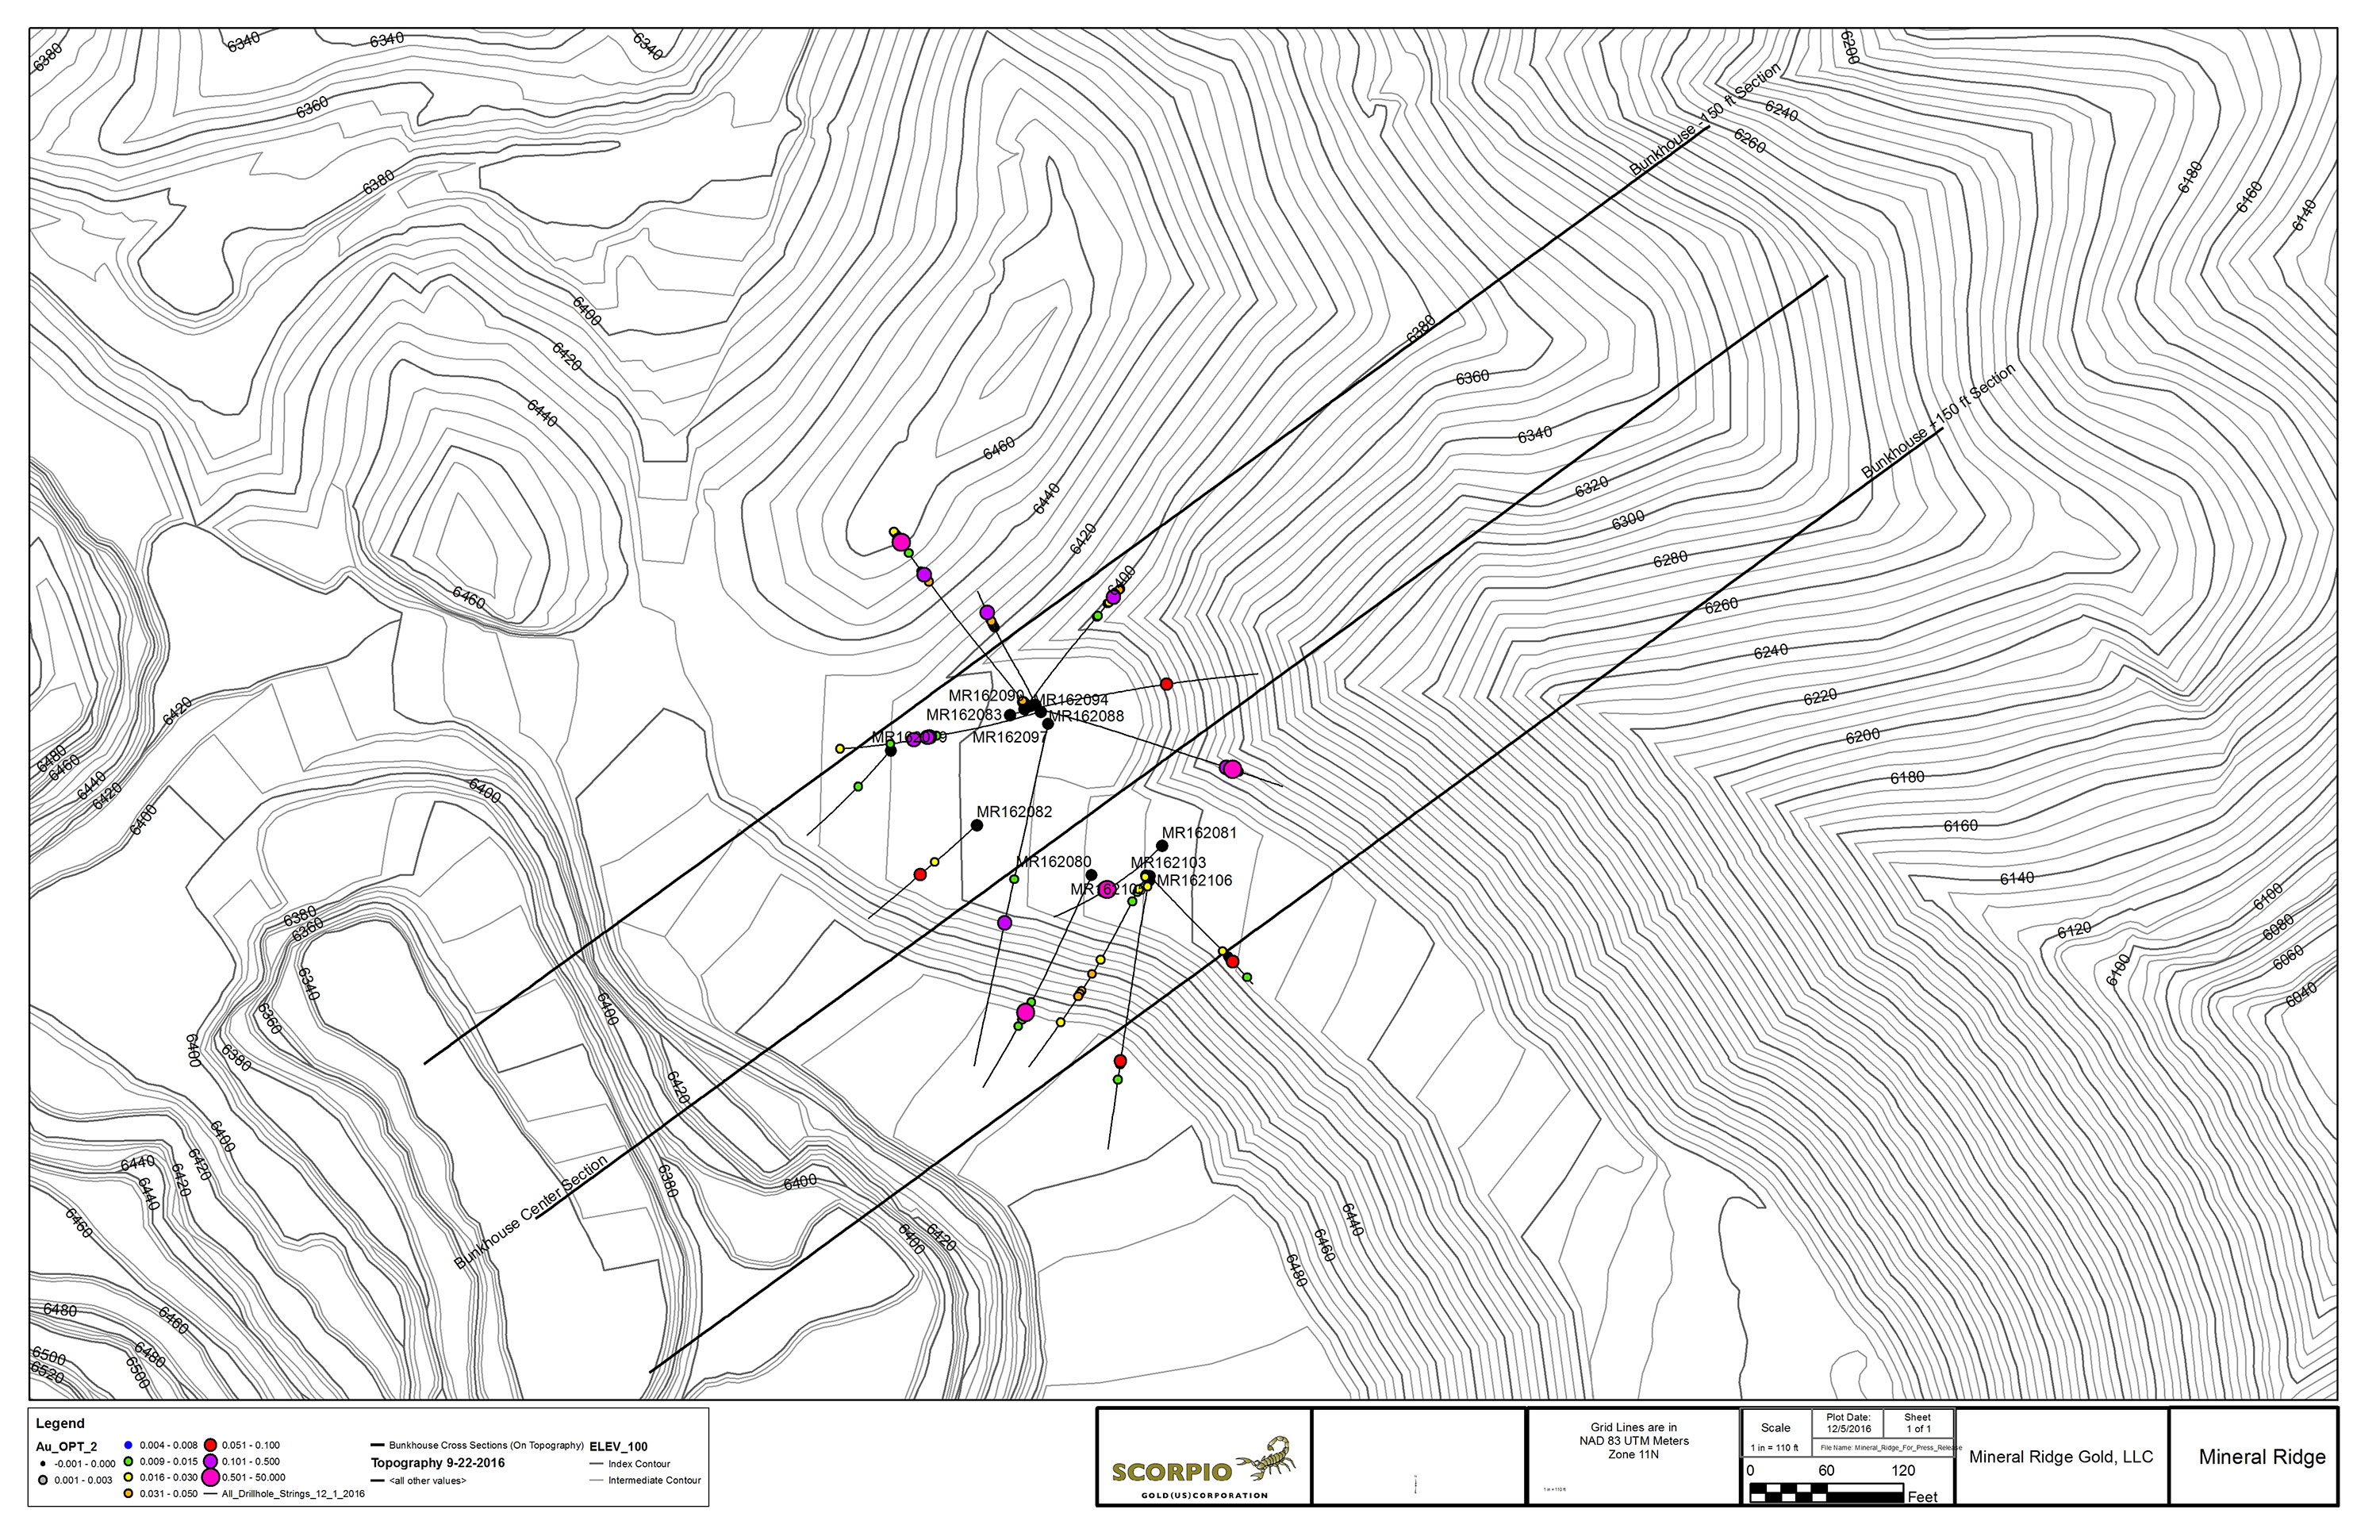
Bunkhouse Hill Drill Cross Sections
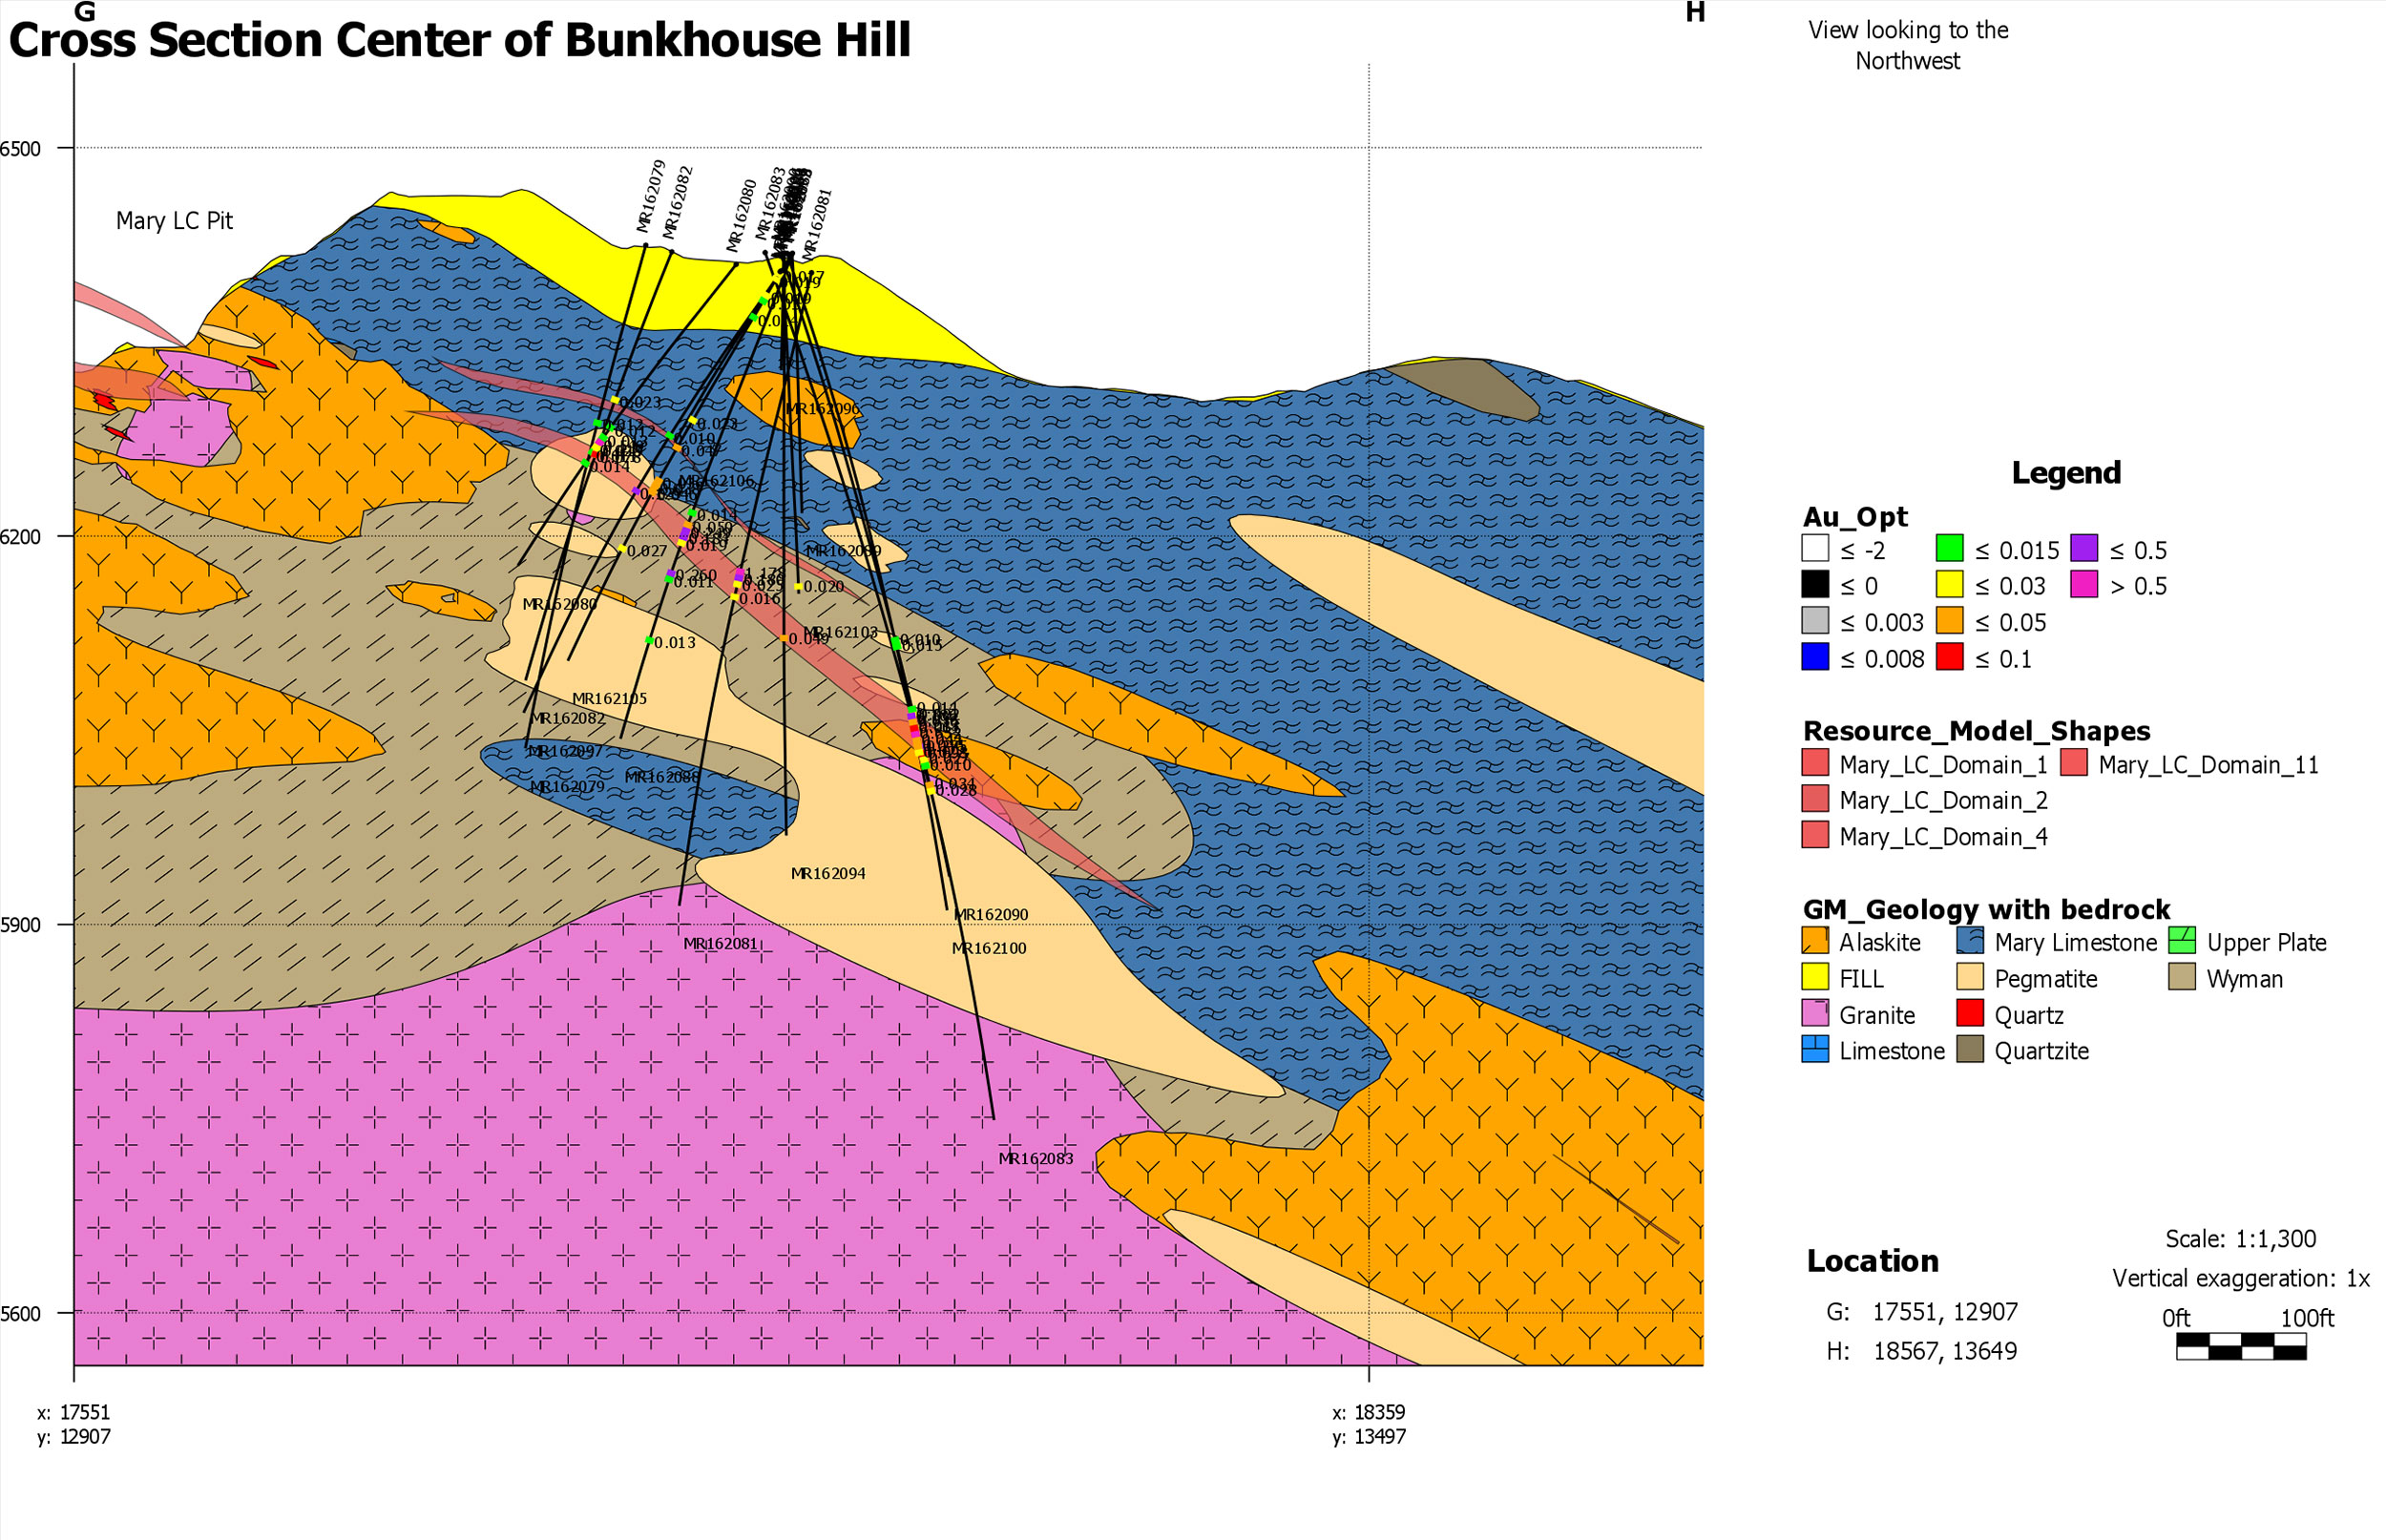 Bunkhouse Hill Section - Center |
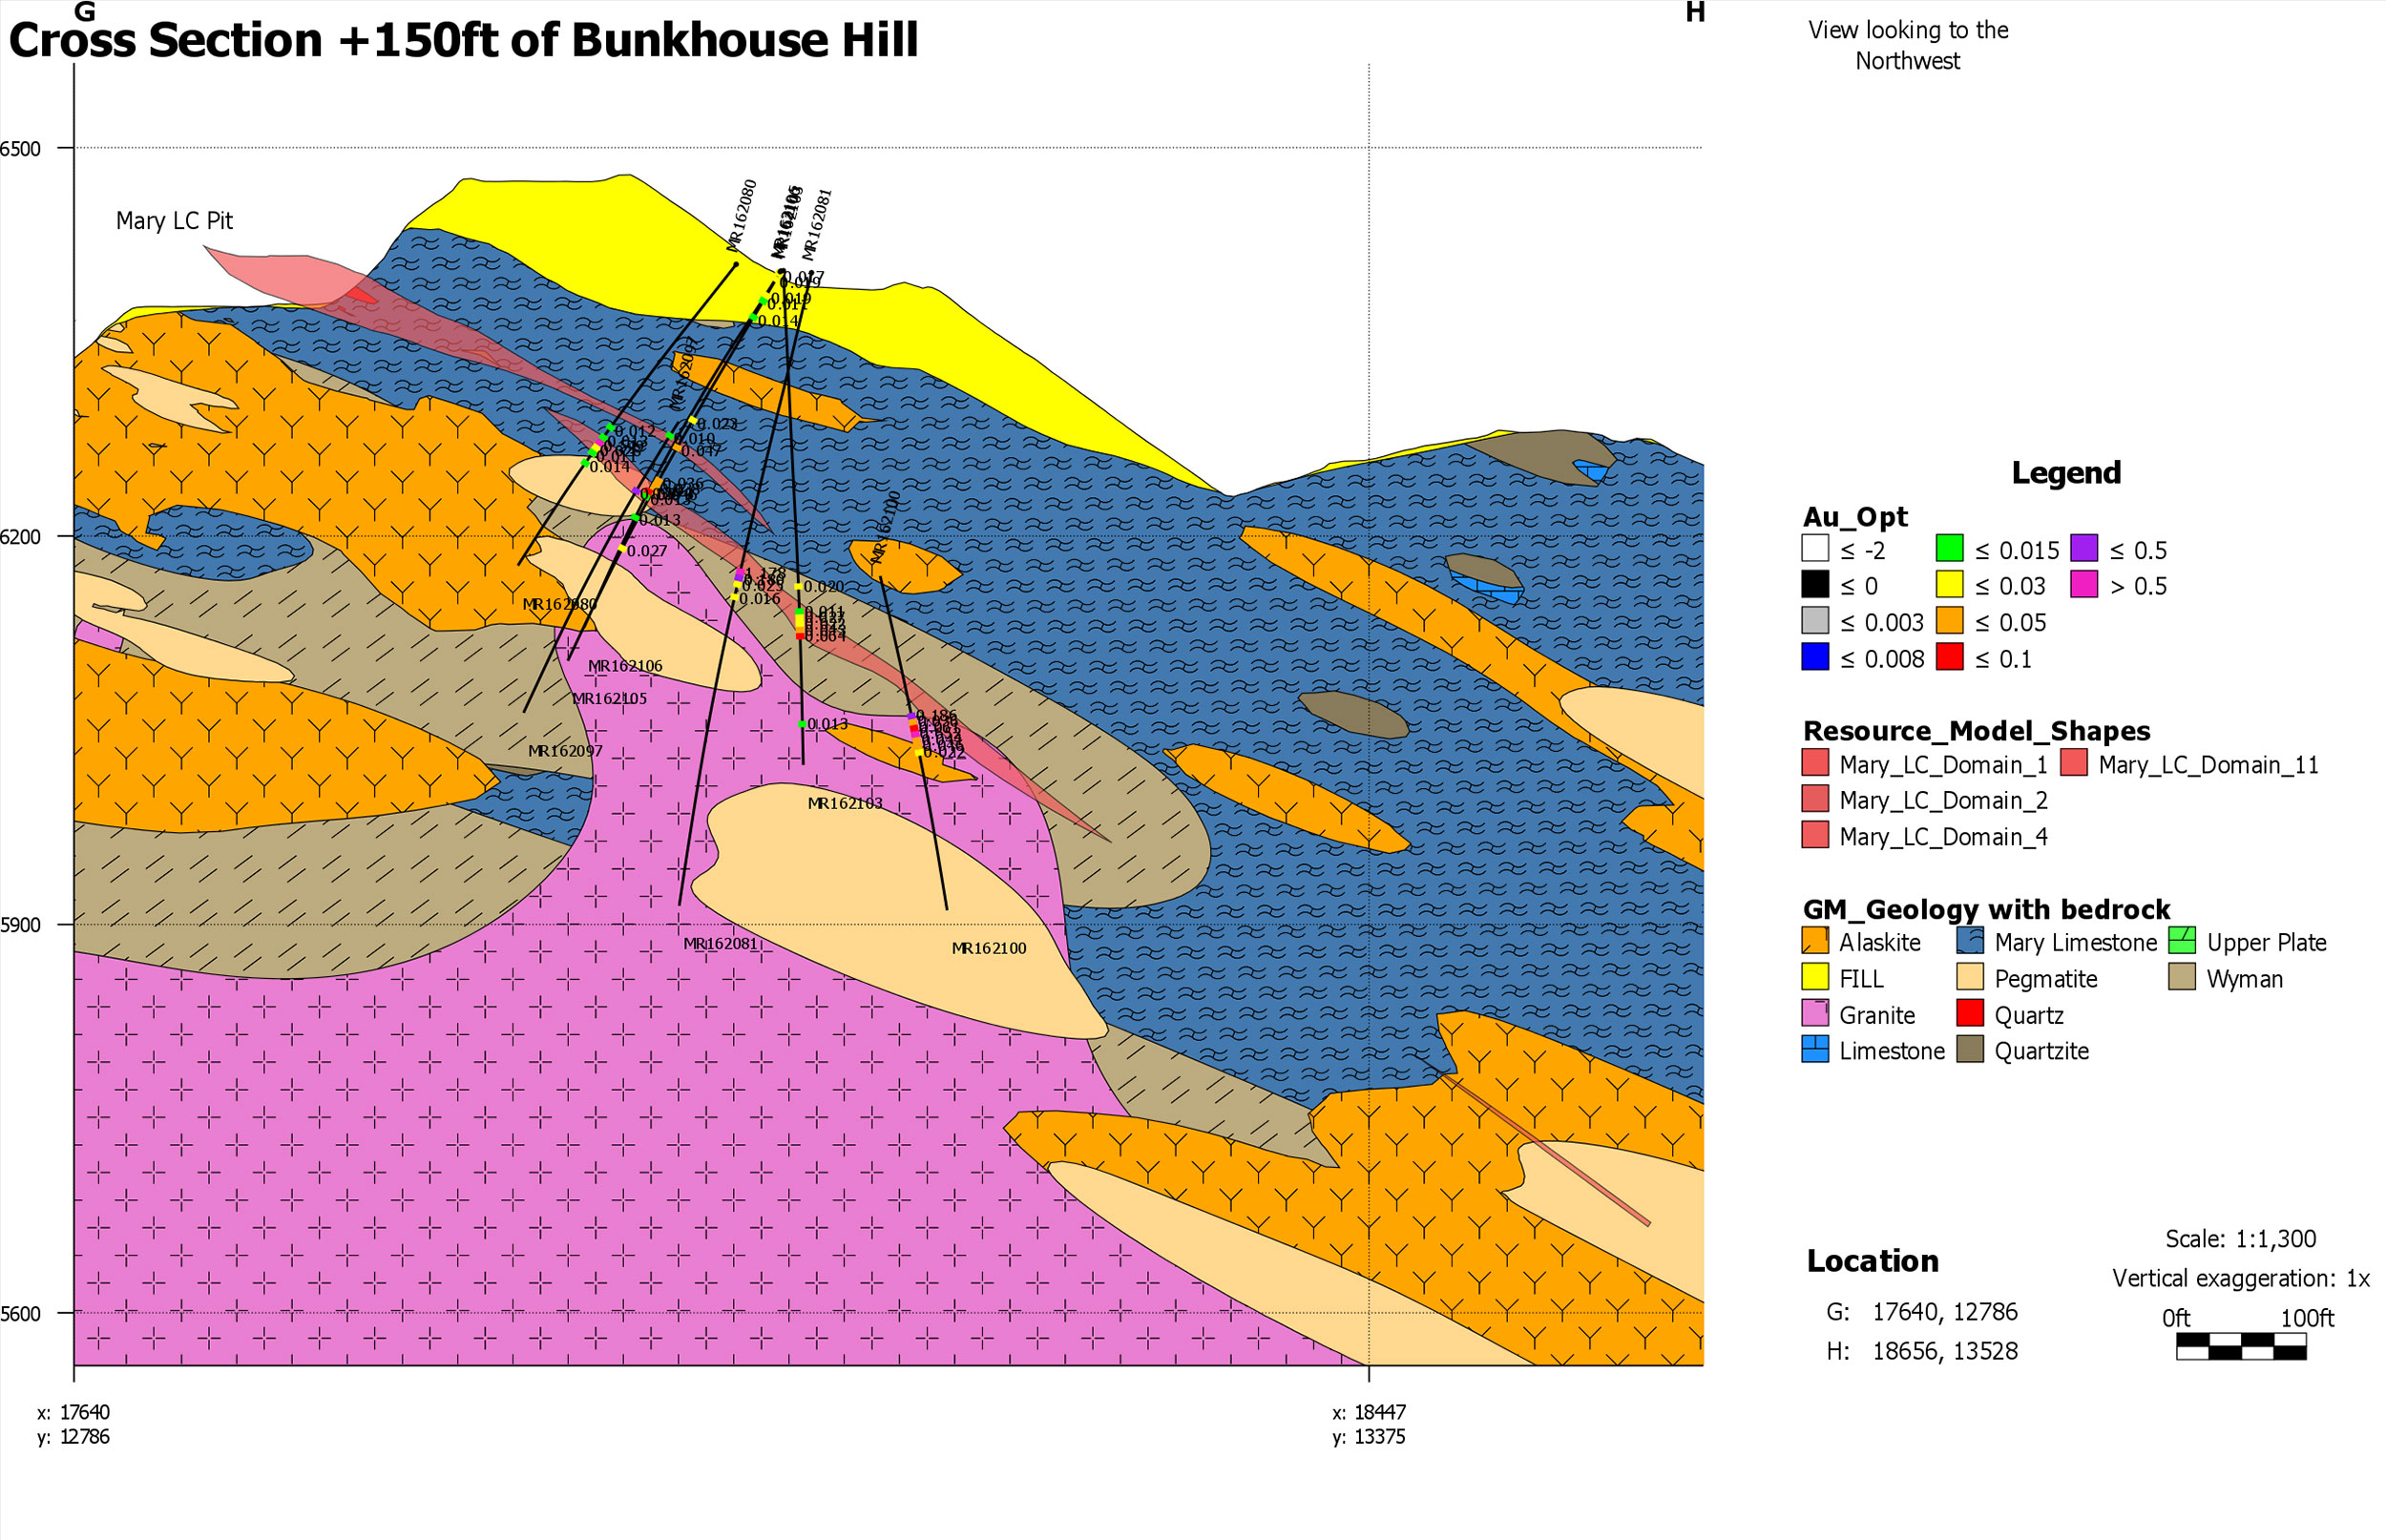 Bunkhouse Hill Section +150 |
|
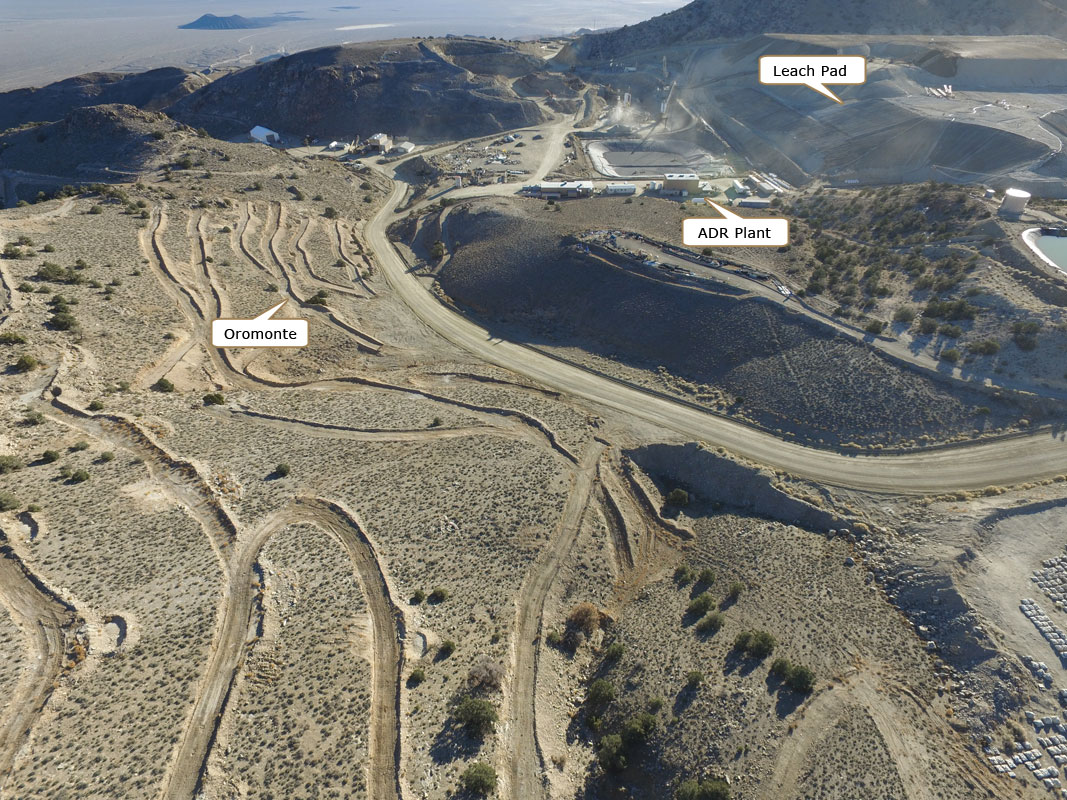
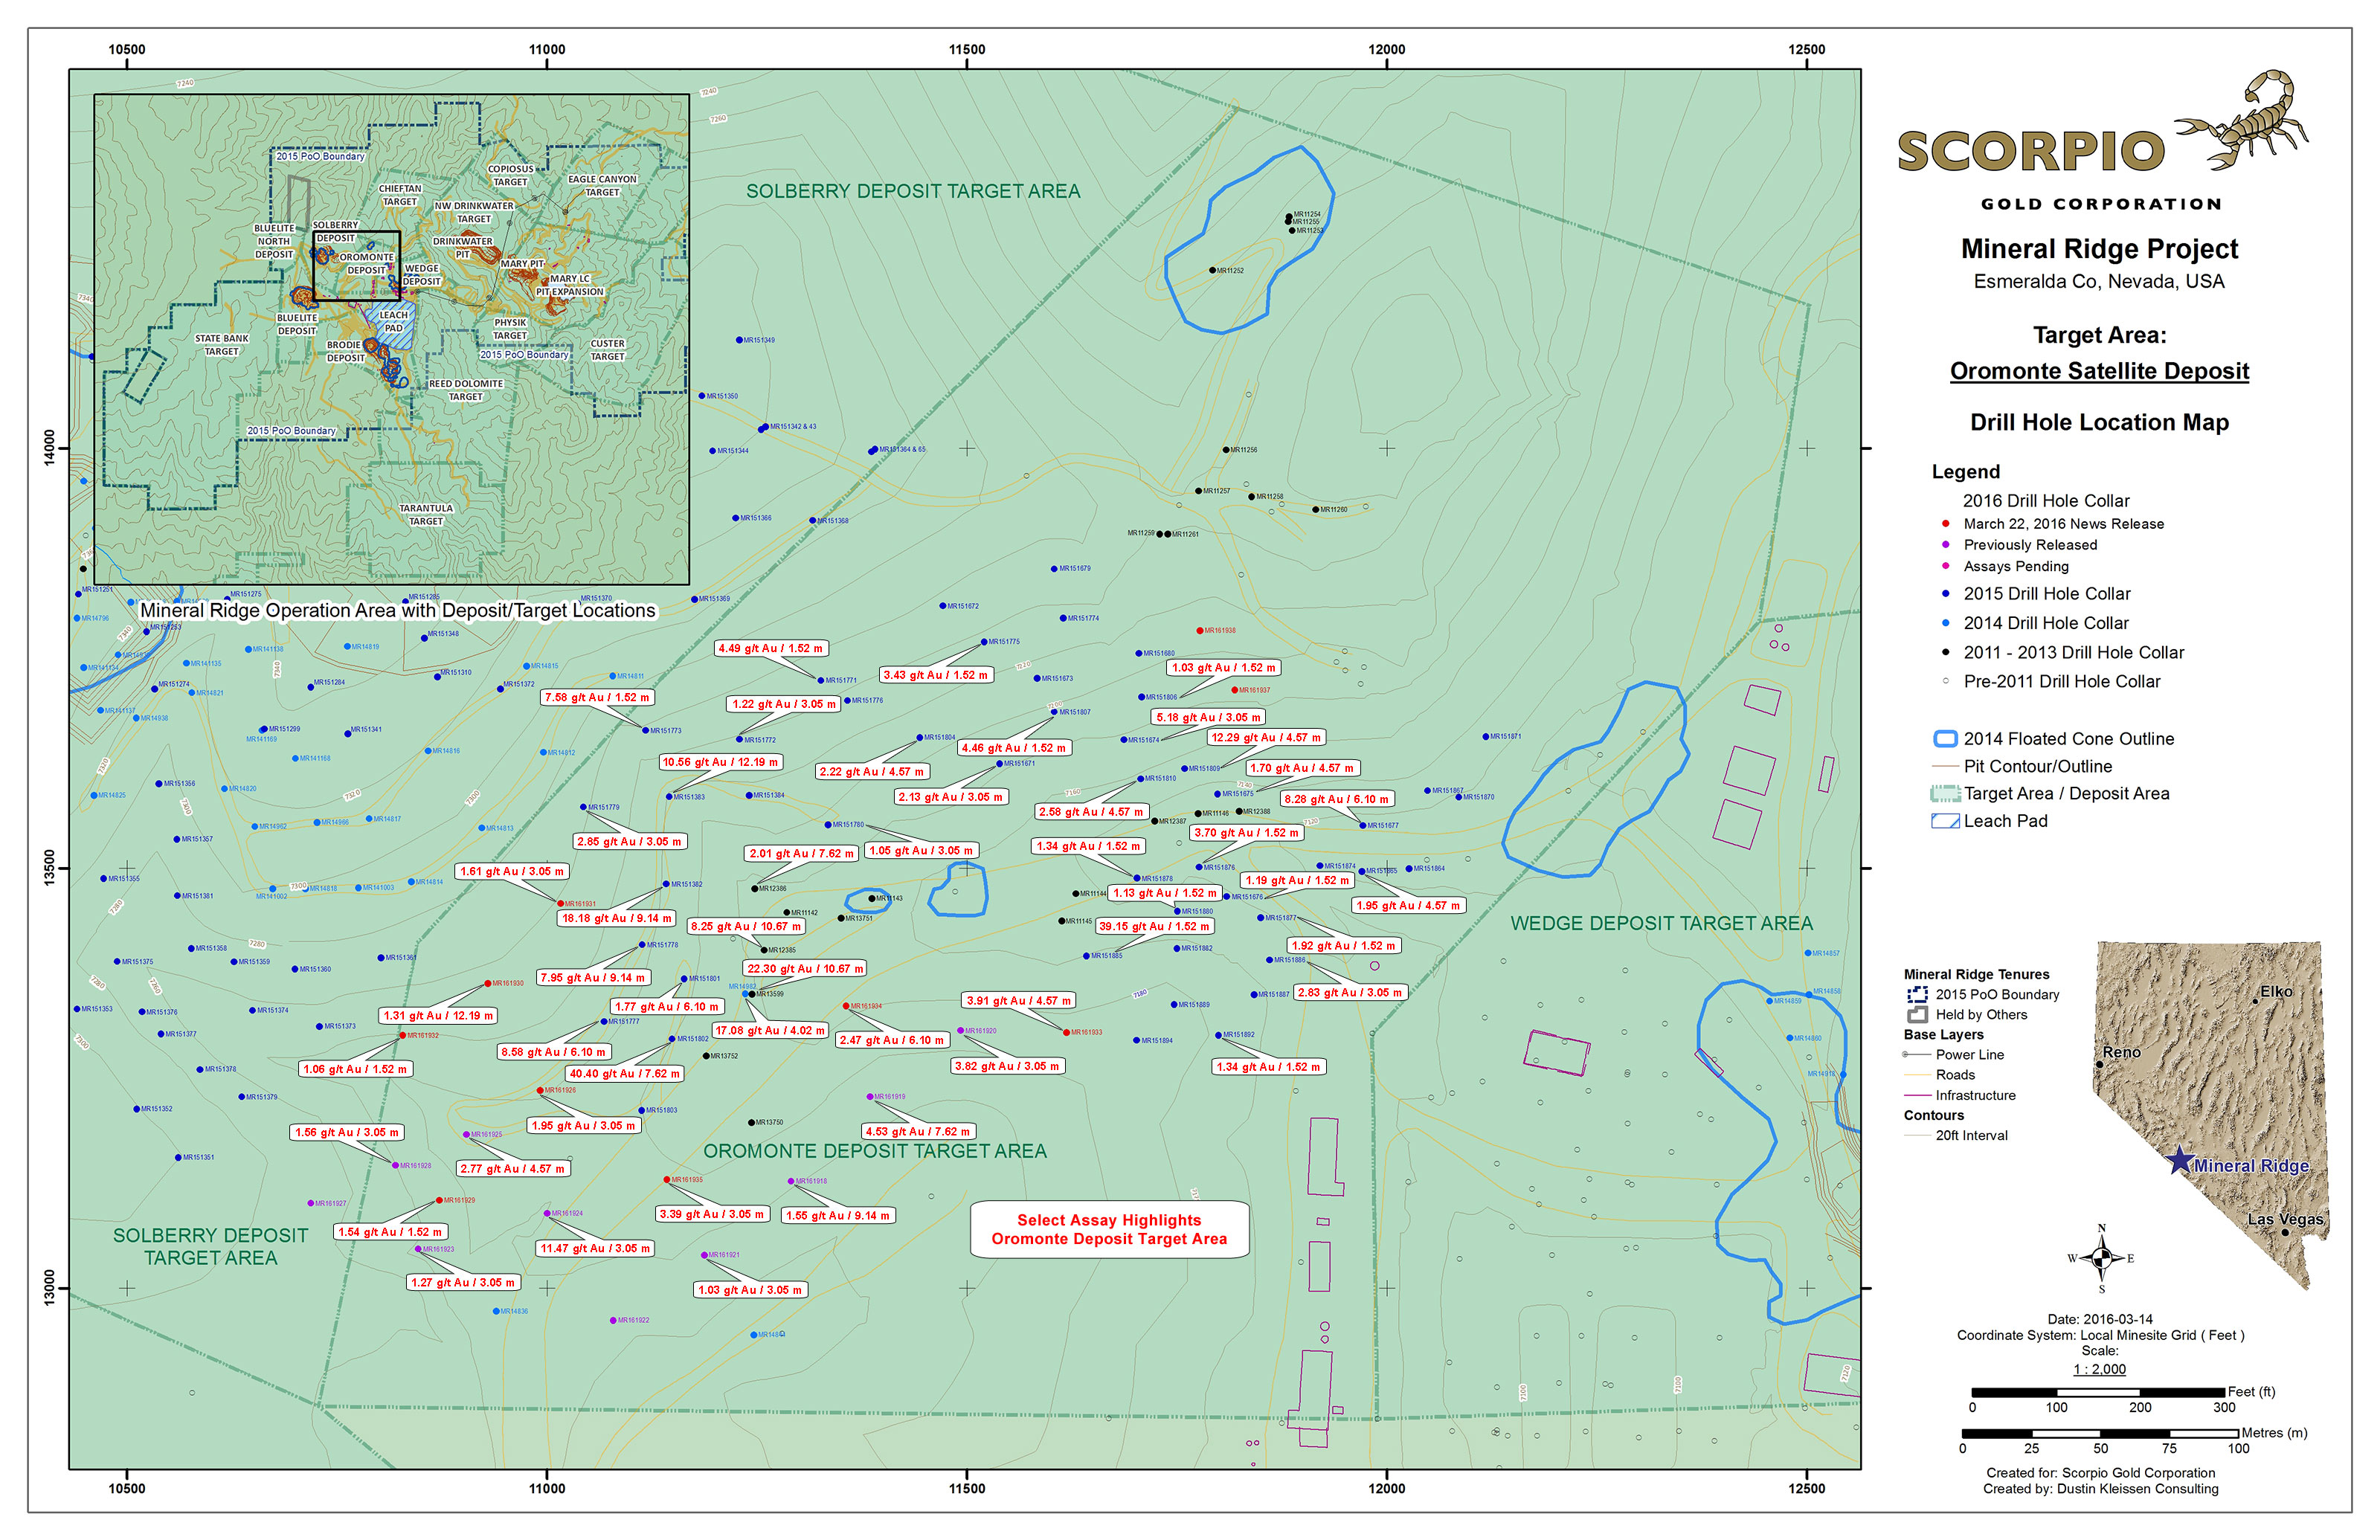
Oromonte Deposit
The Oromonte target occurs over a 300 x 500 meter area situated between the Solberry and Wedge deposits. A small mineral resource estimate for the deposit based on 53 RC drill holes was reported in the 2014 LOM Plan. Follow-up drilling in 2014-2016 intersected significant mineralization at vertical depths ranging from near surface to 150 meters depth across the target area.
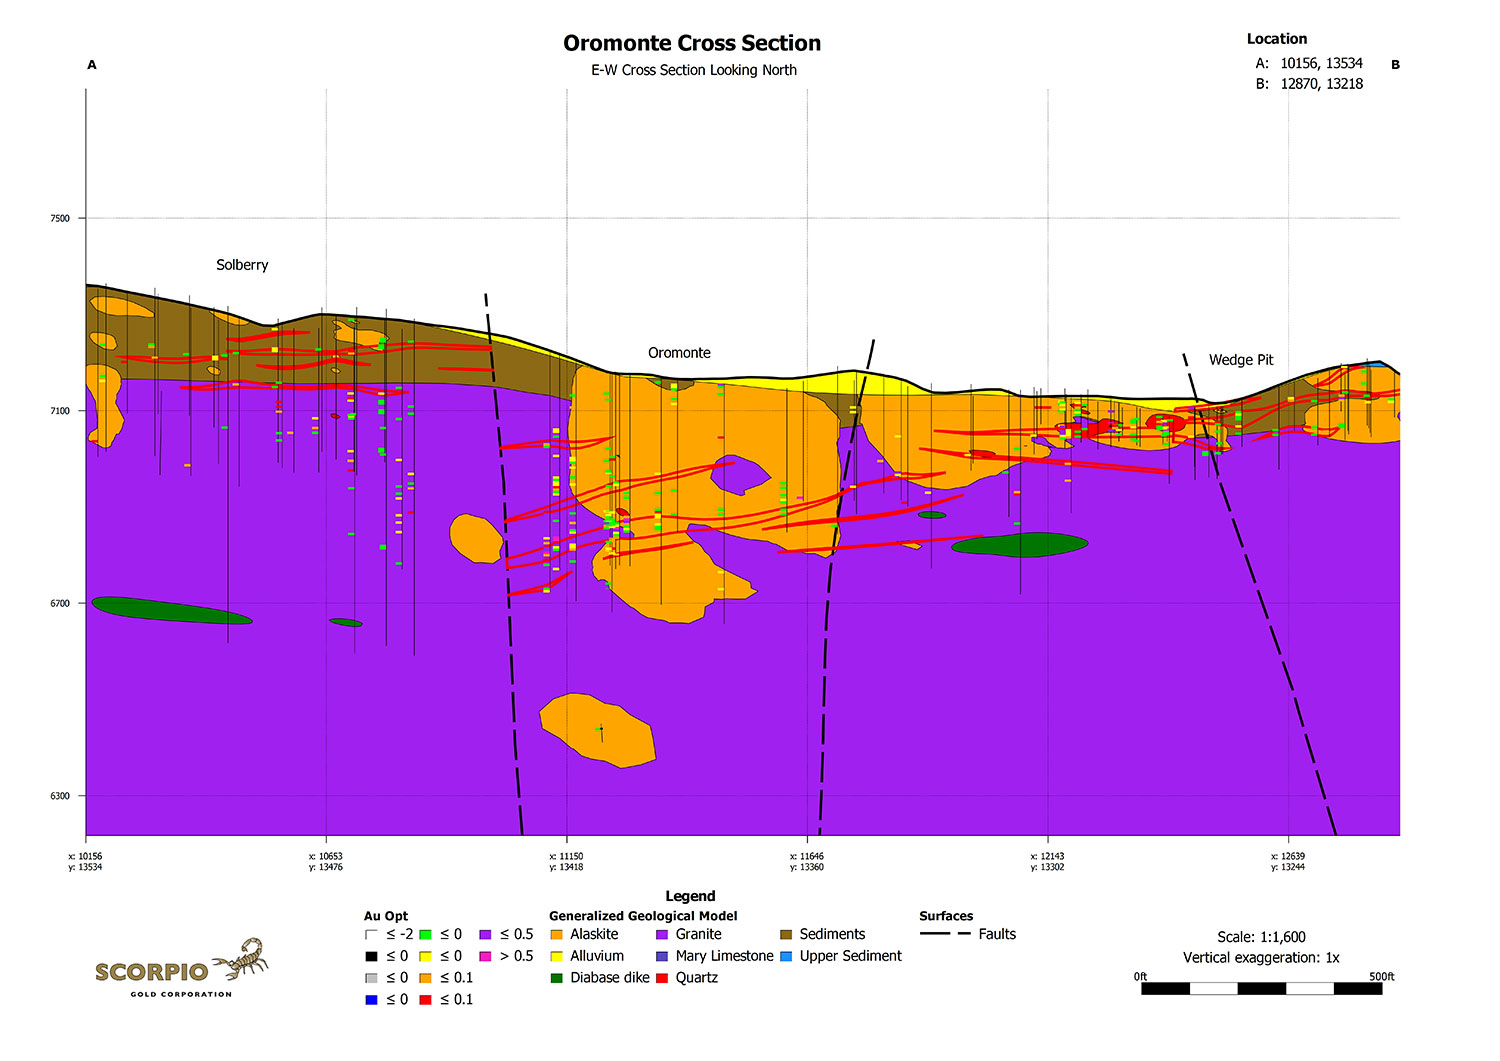
The mineralization at Oromonte is interpreted to be a continuation of the mineralized horizon(s) between the Solberry and Wedge deposits that have been offset by normal faulting. The occurrence of a higher-grade zone of mineralization at depth is thought to be related to a rheological contrast between the basement granite and a later intrusion of alaskite (leucogranite). The difference in deformational behaviour of the two rock types under stress may have caused greater structural damage and fluid flow within the mineralizing structures in this area, resulting in a higher-grade zone of mineralization. The Oromonte deposit was subsequently down-dropped by late-stage normal faulting. A generalized geological model of the mineralization is presented in the Oromonte Cross Section.
Although not accessible by open pit mining, the deeper mineralization at Oromonte may be amenable to underground extraction should further results support underground development. Historical underground workings occur in the Wedge deposit area approximately 180 meters to the east.
Oromonte Drill Plan (PDF 2.2 Mb)
Oromonte Cross Section (PDF 350 Kb)
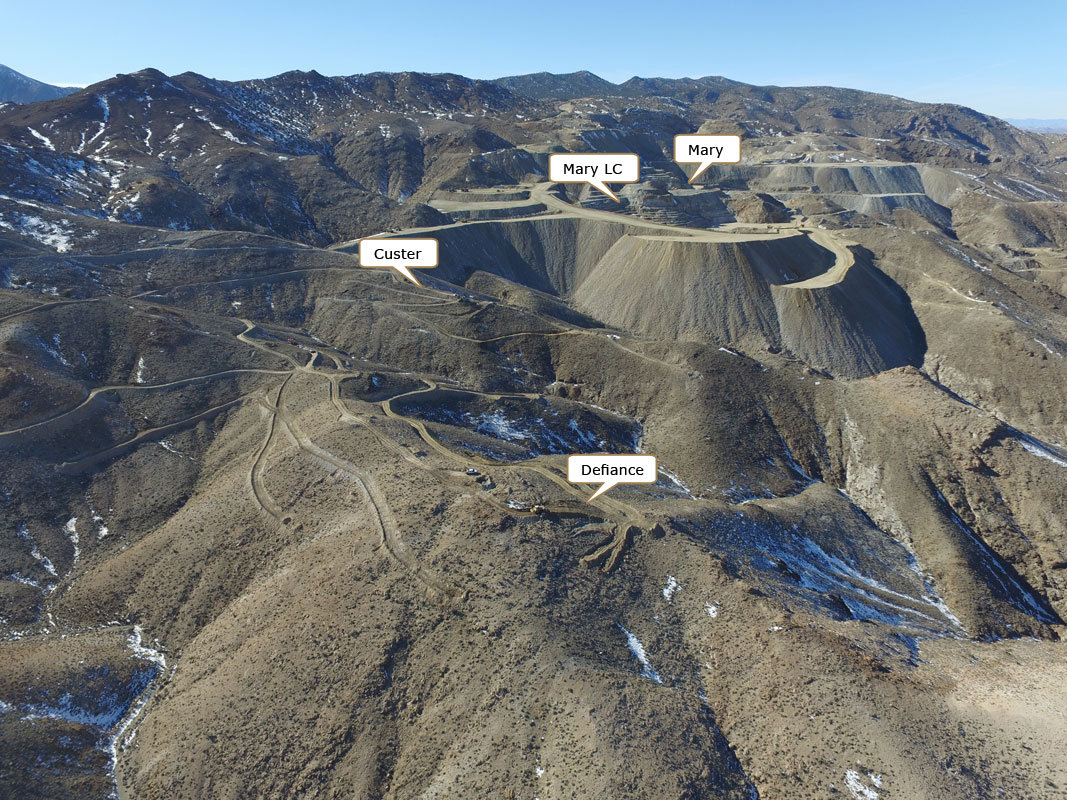
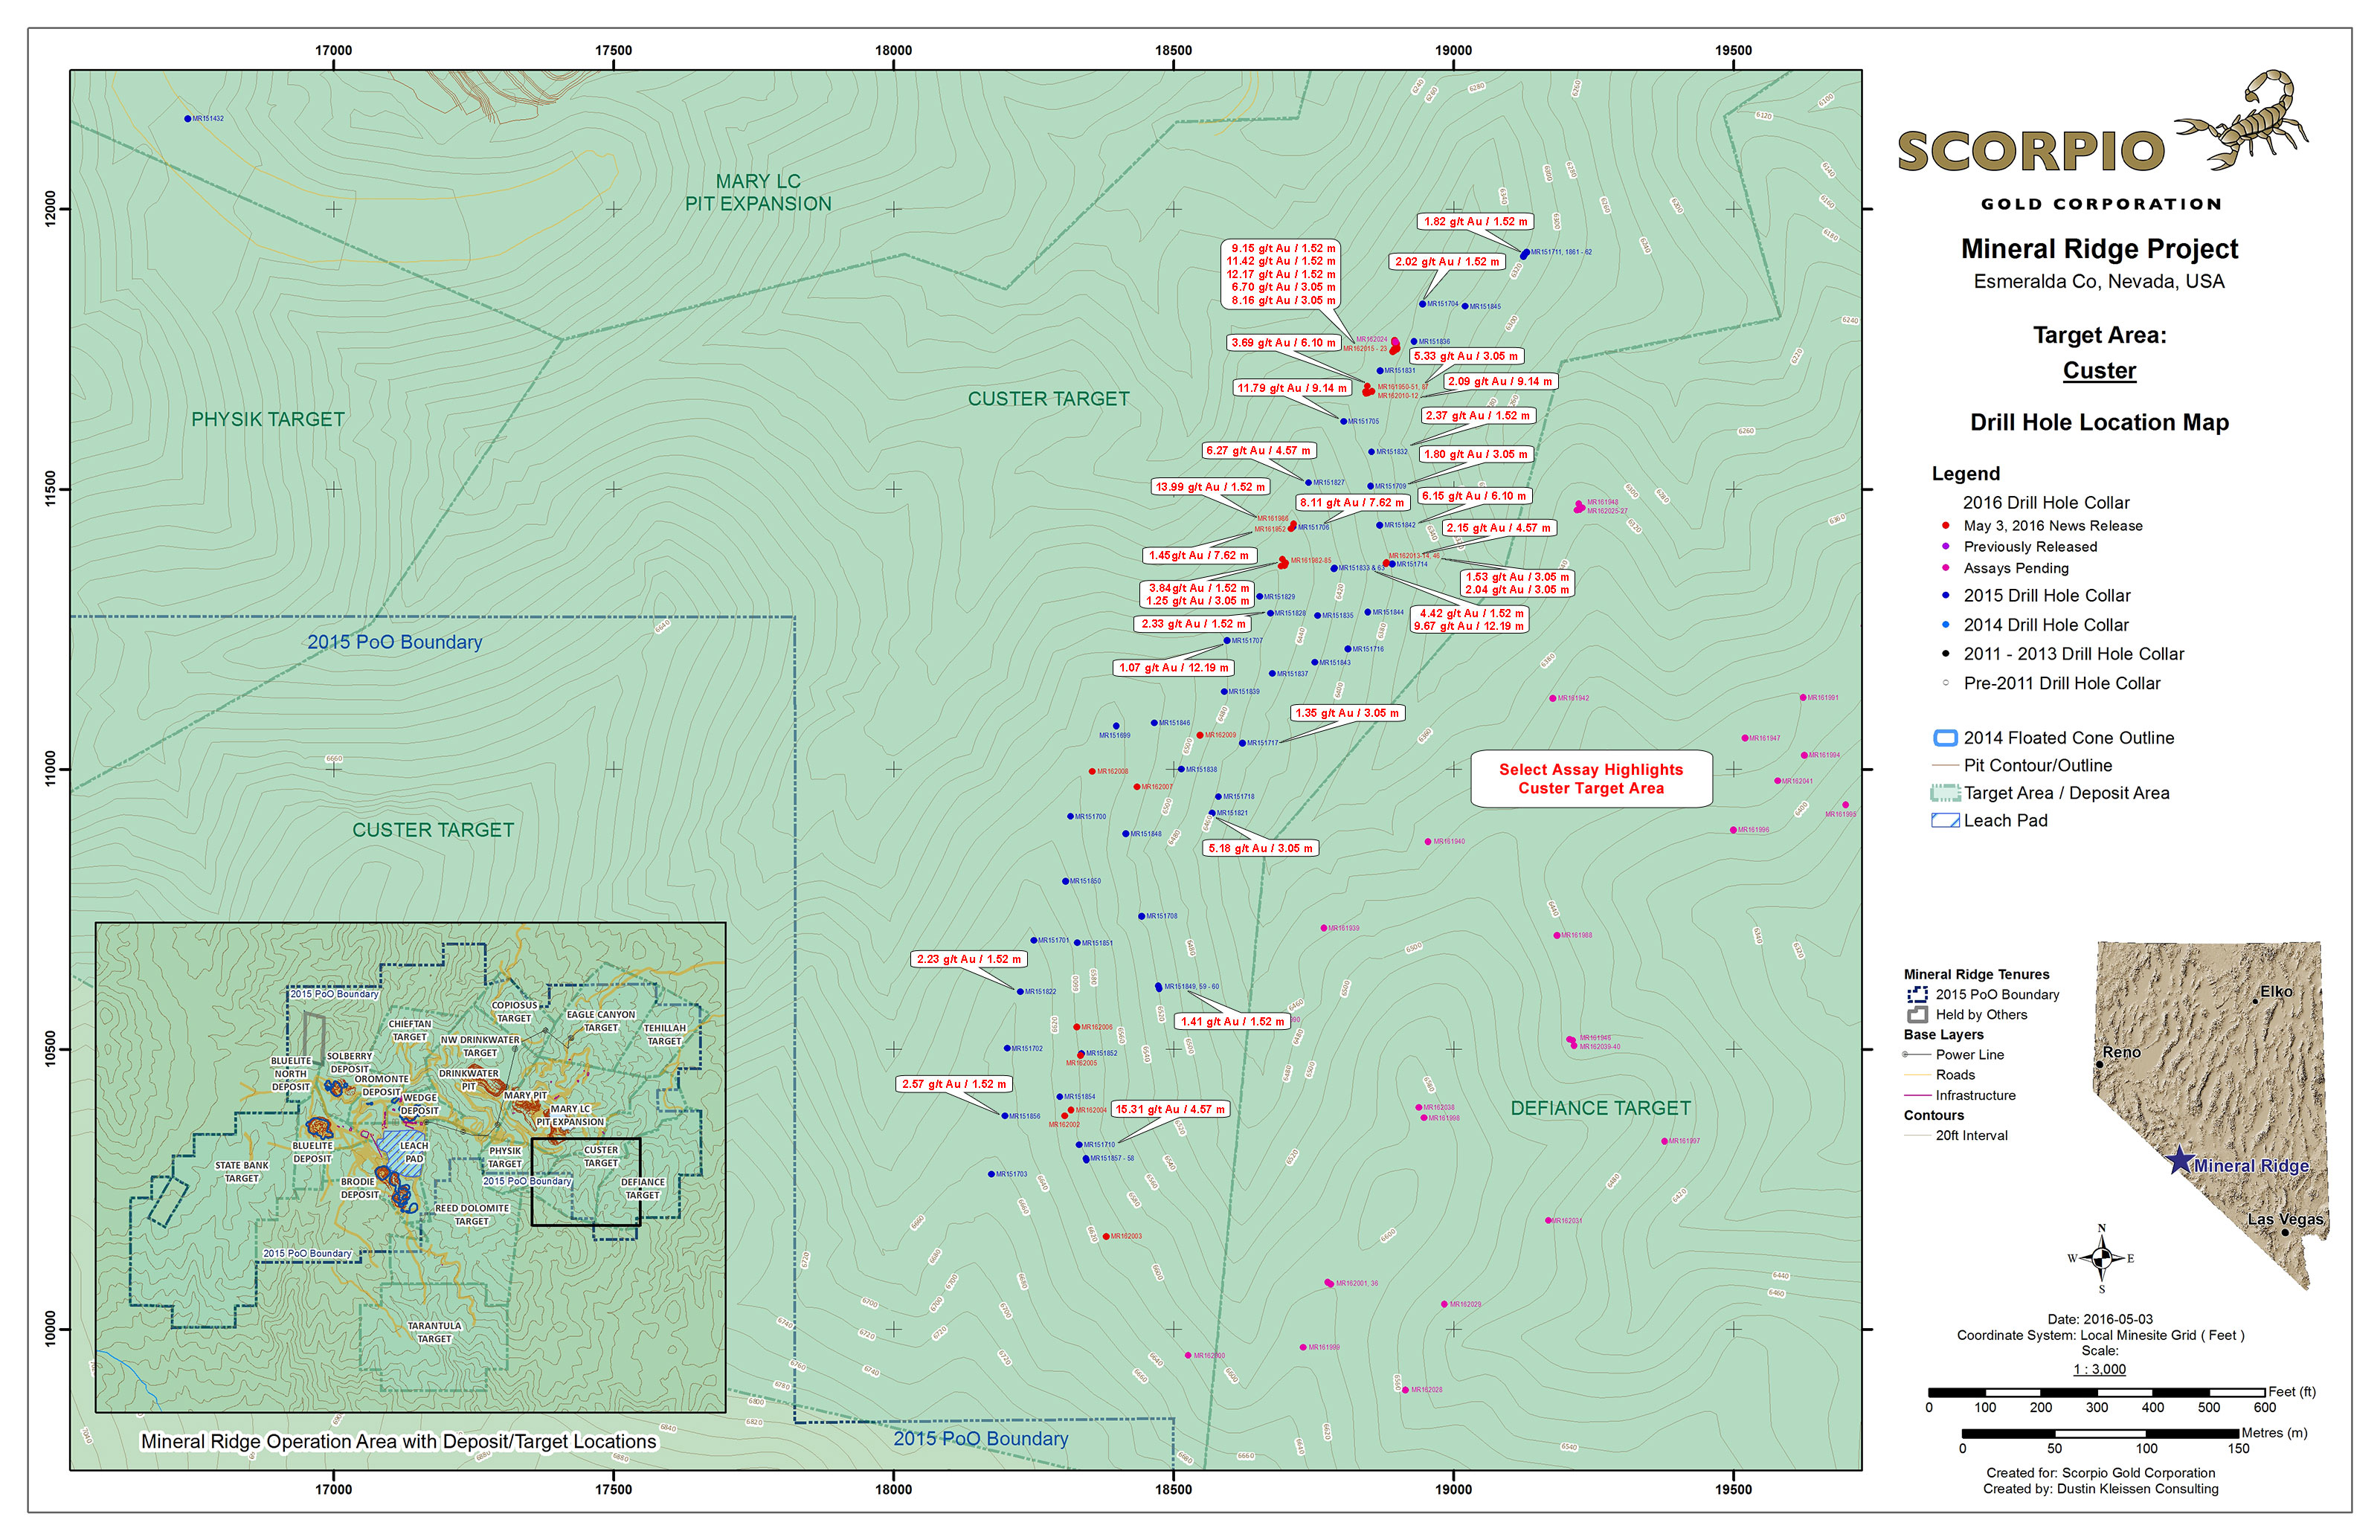
Custer Deposit
Discovered in 2015, the Custer deposit lies along trend of and ~500 meters southeast of the Mary LC deposit. Structurally, Custer is very similar to the Drinkwater deposit, having far less of the post-mineral faulting and folding that was predominant in the Mary and Mary LC deposits. As a result, the mineralization at Custer is quite continuous and predictable. Definition drilling in 2016 followed up on a highly successful first-pass drilling program in 2015. A total of 81 holes have now outlined the Custer mineralized zone over a 150 x 200 meter area at depth (see May 3, 2016 news release). The Custer deposit is in the permitting process for future consideration of open-pit mining.
Geology & Mineralization
The Mineral Ridge gold deposits are located on the northeast flank of the Silver Peak Mountain Range. This range lies in the southern reaches of the Great Basin, within the Walker Lane structural corridor. Walker Lane is a 100-km-wide region of right lateral, wrench-faulting which separates the Sierra Nevada batholith to the west and southwest and the Great Basin to the east and northeast.
Mineral Ridge is an anticlinal dome found on the eastern flank of the Silver Peak Range. It has been interpreted as an uplifted metamorphic core complex where unmetamorphosed and unfolded Cambrian strata are in detachment-fault contact with underlying deformed granitoids and Precambrian metamorphic rocks of the core complex. Auriferous quartz lenses of the central gold-quartz district are concordant with foliation in the metasedimentary host rocks of the Precambrian Wyman Formation. Transitional contacts were observed between quartz and alaskite (commonly pegmatitic), and between alaskite and peraluminous two-mica granite, strongly suggesting that the alaskite, quartz, and ore metals were derived hydrothermally from residual granite melt and aqueous fluids.
The property is located on a typical "Nevada Structural System" which is known to control gold mineralization.

To date, seven well-defined gold bearing structures have been documented on the property as follows:
- The North-Northeast Eagles Nest Fault
- The North-Northeast Coyote Fault
- The Northwest BW Normal Fault
- The North-Northwest Gillian Fault
- The Northeast Mary/Drinkwater Cross Fault
- The North-Northwest Mary/Drinkwater Cross Fault
- The North-Northwest Black Warrior Intersection Fault
The known mineralized zones occur over an area of approximately 4,300 m (14,000 ft) north-south and 4,600 m (15,000 ft) east-west. Individual zones can be as much as 43 m (140 ft) thick, usually consisting of a higher-grade 1.5 to 9.0 m wide halo surrounded by a lower-grade mineralized envelope. Two or more high-grade zones are commonly observed stacked on one another. Gold deposition is structurally controlled, and some of the highest grade material is found in mineralization shoots that are at an oblique angle to the direction of movement of the upper plate slab.
Gold is present as native gold and electrum, and generally occurs as rounded, angular, irregularly shaped and elongated inclusions and intergrowths in quartz, frequently associated with micaceous minerals or carbonates occupying interspatial spaces or fracture filling. Gold is also frequently associated with goethite, sometimes with relict pyrite, and on occasions intergrown with sphalerite, galena, anglesite/cerrusite and pyrite.
Mineral Resource & Reserve Estimates
The Mineral Resource estimate for the material on the heap leach pad that is directly amenable to processing is provided in Table 1. No cut-off criteria have been applied since there will be no selectivity of areas to be processed and the leach pad will be processed in its entirety. The Mineral Resources are reported inclusive of Mineral Reserves and have an effective date of 29 June 2017. Mineral Resources that are not Mineral Reserves do not have demonstrated economic viability.
The Mineral Resource estimate for the open-pit (other) areas is provided in Table 2 (Measured and Indicated) and Table 3 (Inferred). The Mineral Resources are reported inclusive of Mineral Reserves and have an effective date of 30 November 2017. Mineral Resources that are not Mineral Reserves do not have demonstrated economic viability.
Table 1: Mineral Resource Estimate for Mineralization Contained within the Heap Leach Pad
| Mineral Resource Classification | Tons ('000) |
Gold (opt) |
Silver (opt) |
Contained Gold ('000 oz) |
Contained Silver ('000 oz) |
|---|---|---|---|---|---|
| Measured | 2,895 | 0.017 | 0.016 | 48.5 | 46.4 |
| Indicated | 4,220 | 0.017 | 0.018 | 73.2 | 74.1 |
| Measured & Indicated | 7,117 | 0.017 | 0.017 | 121.7 | 120.4 |
| Inferred | 76 | 0.016 | 0.027 | 1.2 | 2.0 |
Notes:
- The effective date of the Mineral Resource estimate is June 29, 2017.
- The QP for the estimate is Mr. Ian Crundwell, P.Geo., of Mine Technical Services.
- Mineral Resources are quoted inclusive of Mineral Reserves. Mineral Resources that are not Mineral Reserves do not have demonstrated economic viability.
- Mineral Resources are contained within the Mineral Ridge leach pad facility with the following assumptions: a long-term gold price of $1,216/oz; assumed process costs of $11/t; and metallurgical recovery for gold of 91%. Silver was not used in the consideration of reasonable prospects for eventual economic extraction. Silver recoveries from heap leach pad material are projected to be 24%.
- Rounding may result in apparent differences when summing tons, grade and contained metal content.
- Tonnage and grade measurements are in Imperial units. Grades are reported in ounces per ton.
Table 2: Measured and Indicated Mineral Resource Tabulation for Other Areas
| Area | Classification | Tons (kt) |
Gold Grade (opt) |
Contained Gold (koz) |
|---|---|---|---|---|
| Brodie | Measured | 455.7 | 0.063 | 28.6 |
| Indicated | 237.9 | 0.056 | 13.4 | |
| Subtotal Measured and Indicated | 693.6 | 0.060 | 41.9 | |
| Custer | Measured | 147.8 | 0.083 | 12.3 |
| Indicated | 75.4 | 0.088 | 6.6 | |
| Subtotal Measured and Indicated | 223.2 | 0.085 | 18.9 | |
| Drinkwater HW | Measured | 527.3 | 0.046 | 24.3 |
| Indicated | 209.2 | 0.049 | 10.3 | |
| Subtotal Measured and Indicated | 736.6 | 0.047 | 34.6 | |
| Mary LC & Bunkhouse | Measured | 721.4 | 0.072 | 51.7 |
| Indicated | 403.3 | 0.074 | 29.8 | |
| Subtotal Measured and Indicated | 1,124.7 | 0.072 | 81.5 | |
| Oromonte | Measured | 235.8 | 0.162 | 38.3 |
| Indicated | 169.0 | 0.074 | 12.6 | |
| Subtotal Measured and Indicated | 404.8 | 0.126 | 50.9 | |
| Combined | Measured | 2,088.0 | 0.074 | 155.2 |
| Indicated | 1,094.8 | 0.066 | 72.6 | |
| Total Measured and Indicated | 3,182.8 | 0.072 | 227.8 |
Notes:
- The effective date of the Mineral Resource estimate is November 30, 2017.
- The QP for the estimate is Mr. Ian Crundwell, P.Geo., of Mine Technical Services.
- Mineral Resources are reported inclusive of Mineral Reserves at a gold cut-off grade of 0.01 opt Mineral Resources that are not Mineral Reserves do not have demonstrated economic viability.
- Mineral Resources are constrained to the area within the grade-shell wireframes. The areas outside of these grade shells are assumed to be at zero grade.
- These Mineral Resource are considered to be amenable to open-pit mining. Conceptual Whittle pit shells used the following assumptions: a long-term gold price of $1,350/oz; assumed combined operating costs of $12.36/t (mining, process, general and administrative); metallurgical recovery for gold of 95%, and variable pit slope angles that ranged from 38--42º.
- Rounding may result in apparent differences between when summing tons, grade and contained metal content. Tonnage and grade measurements are in Imperial units. Grades are reported in ounces per ton.
Table 3: Inferred Mineral Resource Tabulation for Other Areas
| Area | Classification | Tons (kt) |
Gold Grade (opt) |
Contained Gold (koz) |
|---|---|---|---|---|
| Brodie | Inferred | 2.4 | 0.034 | 0.08 |
| Custer | Inferred | -- | -- | -- |
| Drinkwater HW | Inferred | 180.1 | 0.059 | 10.61 |
| Mary LC & Bunkhouse | Inferred | 0.1 | 0.061 | 0.01 |
| Oromonte | Inferred | 0.4 | 0.092 | 0.03 |
| Combined | Total Inferred | 182.9 | 0.059 | 10.73 |
Notes:
- The effective date of the Mineral Resource estimate is November 30, 2017.
- The QP for the estimate is Mr. Ian Crundwell, P.Geo., of Mine Technical Services.
- Mineral Resources are reported inclusive of Mineral Reserves at a gold cut-off grade of 0.01 opt. Mineral Resources that are not Mineral Reserves do not have demonstrated economic viability
- Mineral Resources are constrained to the area within the grade-shell wireframes. The areas outside of these grade shells are assumed to be at zero grade.
- These Mineral Resource are considered to be amenable to open-pit mining. Conceptual Whittle pit shells used the following assumptions: a long-term gold price of $1,350/oz; assumed combined operating costs of $12.36/t (mining, process, general and administrative); metallurgical recovery for gold of 95%, and variable pit slope angles that ranged from 38--42º.
- Rounding may result in apparent differences between when summing tons, grade and contained metal content. Tonnage and grade measurements are in Imperial units. Grades are reported in ounces per ton.
Mineral Reserve Statement
The Mineral Reserve estimates were prepared with reference to the 2014 Canadian Institute of Mining, Metallurgy and Petroleum (CIM) Definition Standards and the 2003 CIM Best Practice Guidelines.
The Mineral Reserve estimate for the material on the heap leach pad is provided in Table 4. The estimate has an effective date of June 29, 2017.
Proven and Probable Mineral Reserves for the open-pit (other) area material are reported within the final pit design used for the mine production schedule and are shown in Table 5. The estimate has an effective date of November 30, 2017.
Table 4: Mineral Reserve Estimate for the Heap Leach Pad
| Mineral Reserve Classification | Tons ('000) |
Gold (opt) |
Silver (opt) |
Contained Gold ('000 oz) |
Contained Silver ('000 oz) |
|---|---|---|---|---|---|
| Proven | 2,895 | 0.017 | 0.016 | 48.5 | 46.4 |
| Probable | 4,220 | 0.017 | 0.018 | 73.2 | 74.1 |
| Less Material Remaining in Place due to facility designs | (260) | 0.017 | 0.017 | (4.5) | (4.6) |
| Total Proven & Probable | 6,855 | 0.017 | 0.017 | 117.2 | 115.9 |
Notes:
- The Mineral Reserves have an effective date of June 29, 2017.
- The QP for the estimate is Mr. Jeffery Choquette P.E., an employee of Hard Rock Consulting.
- Mineral Reserves are contained within the Project leach pad facility with the following assumptions: long-term gold price of $1,216/oz; assumed total ore process costs of $10.59/t; metallurgical recovery for gold of 91%, and 24% for silver, refining and smelting cost of $28.39/oz of gold. Allowance has been made for the facility location which excludes 260,000 t; this material must remain in-place, based on the to the heap material mining and tailings placement design.
- Rounding as required by reporting guidelines may result in summation differences.
Table 5: Mineral Reserve Estimate for the Other Areas
| Pit Area | Mineral Reserve Classification | Tons ('000) |
Gold (opt) |
Contained Gold ('000 oz) |
|---|---|---|---|---|
| Brodie | Proven | 51 | 0.042 | 2.1 |
| Probable | 12 | 0.027 | 0.3 | |
| Subtotal Proven and Probable | 63 | 0.039 | 2.5 | |
| Custer | Proven | 314 | 0.047 | 14.8 |
| Probable | 144 | 0.032 | 4.6 | |
| Subtotal Proven and Probable | 459 | 0.042 | 19.4 | |
| Drinkwater | Proven | 836 | 0.038 | 32.1 |
| Probable | 352 | 0.033 | 11.7 | |
| Subtotal Proven and Probable | 1,189 | 0.037 | 43.7 | |
| Mary LC | Proven | 470 | 0.035 | 16.3 |
| Probable | 276 | 0.035 | 9.7 | |
| Subtotal Proven and Probable | 746 | 0.035 | 26.0 | |
| Bunkhouse | Proven | 239 | 0.047 | 11.1 |
| Probable | 4 | 0.021 | 0.1 | |
| Subtotal Proven and Probable | 243 | 0.046 | 11.2 | |
| Oromonte | Proven | 563 | 0.071 | 39.8 |
| Probable | 449 | 0.030 | 13.7 | |
| Subtotal Proven and Probable | 1,012 | 0.053 | 53.5 | |
| Total Combined | Proven | 2,474 | 0.047 | 116.2 |
| Probable | 1,239 | 0.032 | 40.1 | |
| Total Proven and Probable | 3,713 | 0.042 | 156.3 |
Notes:
- The Mineral Reserves have an effective date of November 30, 2017.
- The Qualified Person for the estimate is Mr. Jeffery Choquette P.E., an employee of Hard Rock Consulting LLC.
- Mineral Reserves are reported within the pit designs at a 0.01 opt gold cut-off grade. Pit designs incorporate the following considerations: base case gold price of $1,300/oz; pit slope angles that range from 38--47º; average life-of-mine metallurgical recovery assumption of 93%; crushing costs of $1.81/t, process cost of $5.79/t, general and administrative and tax costs of $2.90/t; and average mining costs of $1.42/t mined
- Rounding as required by reporting guidelines may result in summation differences.
An NI 43-101 compliant technical report in support of the resource and reserve estimates and associated updated feasibility study was filed on SEDAR on January 9, 2018.
Updated Feasibility Study
On January 4, 2018 the Company announced the results of an updated positive feasibility study ("the Project") to process the heap leach material and additional open-pit mineral reserves at its Mineral Ridge property ("the Property"). This updated feasibility study includes the economic results of processing the reserves, in addition to the previously issued feasibility study (refer to press releases of October 10, 2017 and November 6, 2017) which considered only the processing of the heap leach pad reserves.
Economic Parameters
The economic viability of the Project has been evaluated using constant dollar after-tax discounted cash flow methodology. This valuation method requires projecting material balances estimated from operations and calculating resulting economics. Economic value is calculated from sales of metal, plus net equipment salvage value and bond collateral less cash outflows such as operating costs, management fees, capital costs, working capital changes, any applicable taxes and reclamation costs. Of the $67.5 million in total capital required for the Project, $28.9 million is financed through a capital lease. Resulting annual cash flows are used to calculate the net present value and internal rate of return of the Project.
The economic evaluation is based on the estimated Mineral Reserves on the heap leach pad as of June 29, 2017, plus the Mineral Reserves estimated in other areas that can be mined using open pit methods. Since the Project entails use of infrastructure active up to, and including, the time of capital investment, continuity of administrative and certain operational activities is expected, which allows certain costs to be determined based on actual history. Otherwise, operating and capital costs for proposed new activities have been derived by third-party engineers.
During the Project life (one year of initial capital investment and seven-and-one-half years of operation), the site will undergo further evaluation to extend its operating life, and as such, no end-of-project reclamation is included in this Project analysis.
The open-pit mining equipment is assumed to be acquired through a capital lease. The lease is modeled at a four-year term at 6% interest. Interest payments are reported as cash operating costs, principal payments reduce cash as a financing activity and costs are booked as assets on the balance sheet.
Economic Results
Based on the economic parameters summarized above, the Project returns a NPV5% (after-tax) of $35.1 million and an IRR of 30.0%, and achieves payback in 2.9 years (Table 6).
Table 6: Economic Results
| Area | Unit | Total/Average |
|---|---|---|
| Construction Period | years | 1 |
| Operating Period | years | 7.5 |
| Heap leach Pad Material Milled | kt | 6,855 |
| Average Leach Pad Gold Grade | opt | 0.017 |
| ROM Material Milled | kt | 3,712 |
| ROM Material Gold Grade | opt | 0.042 |
| Recovery After Process and Refining | % | 91.6 |
| Life of Project Gold Sold | koz | 250.5 |
| Average Annual Gold Sold | koz/a | 33.4 |
| Gold Price | $/oz | 1,250 |
| Realized Gold Price | $/oz | 1,249.50 |
| Average Silver Grade | opt | 0.017 |
| Average Annual Silver Sold | koz/a | 3.7 |
| Realized Silver Price (Average) | $/oz | 19.81 |
| Total Cash Cost | $/oz | 805 |
| Initial capital expenditures | $ million | 34.9 |
| Remnant Ore Capital Expenditures (Ops Year 6) | $ million | 32.6 |
| Total After-tax Net Cash Flow | $ million | 53.5 |
| Net Salvage Value | $ million | 13.1 |
| NPV of Net Cash Flow Discounted at 5% | $ million | 35.1 |
| IRR | % | 30.0 |
| Payback from End of Construction | years | 2.9 |
Management anticipates that the Project returns could potentially be further enhanced through the judicious sourcing and refurbishment of certain used equipment, available for purchase in the south-western United States. However, no economic studies have been undertaken with respect to sourcing and refurbishing used equipment, including the Feasibility Study which is based on new equipment only.
Sensitivity Analysis
Project sensitivity to variations in operating costs, capital costs, gold grade and metals price was evaluated with respect to the NPV. The NPV5% (after-tax) of the Project is more sensitive to changes in metal price and metal grade, as compared to changes in CAPEX and OPEX. For example, at a gold price of $1,100/oz, a 12% decrease, the NPV5% (after-tax) decreases to $10 million and the IRR declines to 13%. At a gold price of $1,400/oz, a 12% increase, the NPV5% (after-tax) increases to $58 million and the IRR increases to 43%.
The NPV sensitivity to CAPEX, OPEX, gold price and head grade is shown graphically in Figure 1 below
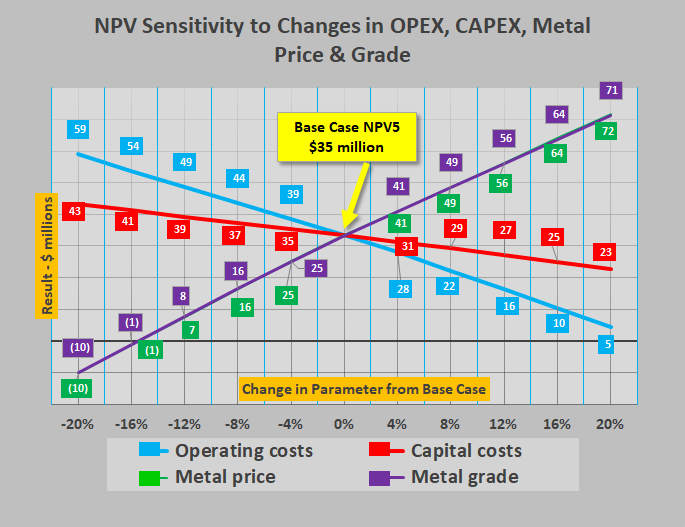
Note: Figure prepared by MTS, 2017
Similarly, the sensitivity of the IRR to CAPEX, OPEX, gold price and head grade is shown graphically in Figure 2 below.
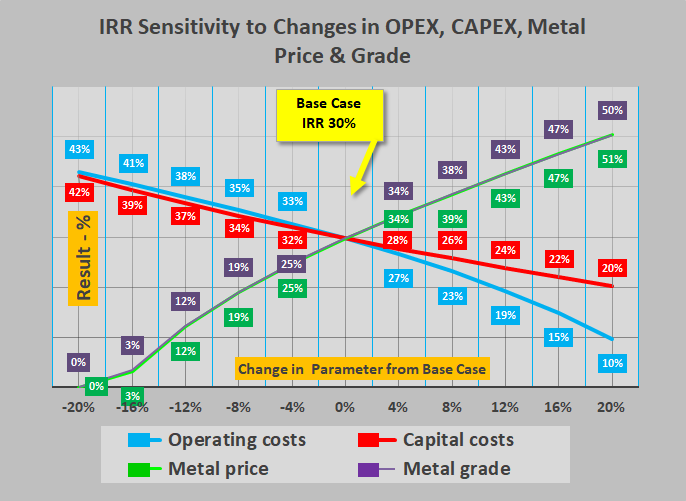
Note: Figure prepared by MTS, 2017
Conclusions
Based on the updated Feasibility Study, the Project, as defined in the technical report, is technically and economically viable. It is therefore recommended that Scorpio Gold construct the new processing facilities as described, to process the heap leach material as well as the reported open-pit reserves at the Property.
Units of Measure
Unless otherwise defined herein, the following defined terms have the following meanings:
| Unit< | Symbol |
|---|---|
| foot | m |
| gram | g |
| ounce | oz |
| pound | lb |
| ton (short = 2,000 lb) | t |
| ounces per ton | opt |
| kilo (x 1,000) | k |
| million (x 1,000,000) | N |
| hour | h |
| minute | min |
| year | y |
| day | d |
| annum | a |
| tons per hour | tph |
| tons per day | tpd |
| tons per annum | tpa |
| US gallon | gal |
| cubic feet | ft3 |
| US gallons per minute | gpm |
| US dollars | $ |
Qualified Persons
The following are Qualified Persons ("QP"s) as defined by NI 43-101 and participated in the preparation of the feasibility study:
| Qualified Person | Company | QP Responsibility/Role |
|---|---|---|
| Mr. Todd Wakefield, RM-SME | Mine Technical Services | Geology |
| Ms. Stella Searston, RM-SME | Mine Technical Services | Geology |
| Mr. Ian Crundwell, P. Geo. | Mine Technical Services | Mineral Resources |
| Mr. Jeff Choquette, P.E. | Hard Rock Consulting, LLC | Mineral Reserves and Mining Methods |
| Mr. Paul Kaplan, P.E. | NewFields | Environment Studies and Permitting |
| Mr. Gordon John Cooper, P. Eng. | Novus Engineering Inc. | Mineral Processing |
| Mr. Amritpal Singh Gosal, P. Eng. | Novus Engineering Inc. | Infrastructure and Plant Design |
| Mr. Bruce Genereaux, RM-SME | Mine Technical Services | Economic Analysis |
An NI 43-101 compliant technical report in support of the resource and reserve estimates and associated updated feasibility study was filed on SEDAR on January 9, 2018.